This Amazon SWOT analysis reveals how the largest online retailer used its competitive advantages to become the dominant player in the retail industry.
It identifies all the key strengths, weaknesses, opportunities and threats that affect the company the most. If you want to find out more about the SWOT of Amazon, you’re in the right place.
For more information on how to do a SWOT analysis please refer to our article.
Keep reading.
Company Overview
| Name | Amazon.com, Inc. |
|---|---|
| Founded | July 5, 1994 |
| Logo |  |
| Industries served | Cloud computing (Amazon Web Services) E-commerce (Amazon Marketplace, Amazon Prime) Digital distribution (Prime Video, Audible, Twitch) Retail (Whole Foods) Consumer Electronics (Kindle, Fire tablet, Fire TV, Echo and Ring) |
| Geographic areas served | Worldwide (Amazon Marketplace in 20 countries) |
| Headquarters | Seattle, Washington, U.S. |
| Current CEO | Andy Jassy |
| Revenue (US$) | $637.959 billion (2024) |
| Net Income (US$) | $59.248 billion (2024) |
| Employees | 1,556,000 (2024) |
| Main Competitors | Alibaba Group, Apple Inc., eBay, Inc., Facebook Inc., Alphabet (Google Inc.) Inc., International Business Machines Corporation, Microsoft Corporation, Netflix Inc., The Walt Disney Company, Walmart Inc., and many other internet, retail, consumer electronics and video entertainment companies. |
You can find more information about the business in Amazon.com official website or Wikipedia’s article.
Amazon SWOT Analysis
| Strengths | Weaknesses |
|---|---|
| 1. Low cost structure, the largest merchandise selection and a huge number of third party sellers 2. Synergies between Marketplace, Amazon Web Services (AWS) and Prime and subscription services 3. Unmatched brand reputation in the retail sector 4. Innovative fulfillment centers and distribution software 5. Reliability and low prices of AWS makes it one of the most attractive cloud computing services on the market | 1. Increasing long-term obligations-to-assets ratio 2. Poor R&D capabilities leading to a weak patent portfolio 3. Comparably few physical locations, limiting Amazon’s expansion potential 4. Very low margins on retail business |
| Opportunities | Threats |
|---|---|
| 1. Online grocery sales will reach US$59.5 billion by 2023 2. Increasing demand for voice-controlled virtual assistants in home devices 3. Growing market for subscription-based video on demand services 4. The Internet of Things (IoT) market is expected to grow significantly over the next decade | 1. Wal-Mart’s efforts to establish itself as a leading online retailer 2. Risk of data breaches 3. Amazon could potentially be sued for infringing intellectual property rights 4. The rising U.S. dollar exchange rate could negatively affect the company’s revenue and profits |
Strengths
1. Low cost structure, the largest merchandise selection and a huge number of third party sellers
Amazon is the largest e-commerce retailer in the world. In 2020, the company earned US$197.346 billion from online stores’ sales and an additional US$80.461 billion from the commissions of the third-party sellers’ sales in its online stores. In total, the company’s online retail operations brought in a massive US$277.807 billion in revenues – more than the next few largest e-commerce retailers earned combined.[1]
Amazon’s extraordinary e-commerce growth with its US$16.227 billion sales from the physical stores has allowed the company to become the 2nd largest retailer in the world, only behind Wal-Mart, when compared to other e-commerce and brick and mortar companies.
Figure 1. Amazon growth rate compared to the U.S. e-commerce sales growth
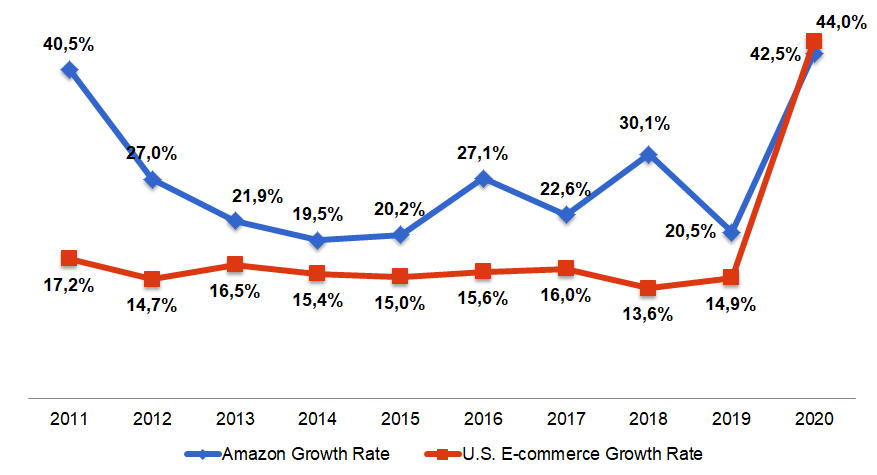
Note that Amazon’s e-commerce has grown much faster than the entire U.S. e-commerce market, meaning that the company has actually increased its market share by taking it from the competitors every single year except 2021, when the company’s e-commerce sales grew at the same rate as the market.
What is the key to such success? According to the Amazon’s report, the online store’s success lies in its low cost structure, the largest merchandise selection and a huge number of third party sellers.
Figure 2. Jeff Bezos “napkin sketch” outlining Amazon’s strategy
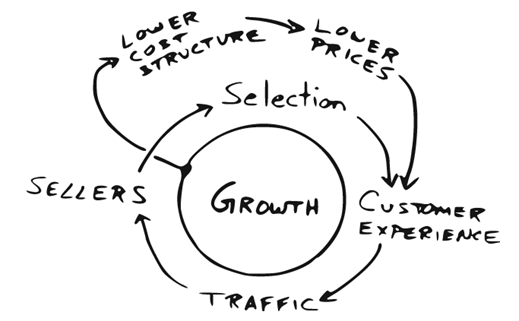
A low-cost structure leads to lower prices, which combined with a huge range of products, results in a better customer experience. Satisfied customers invariably return to the Amazon websites, creating ever-growing traffic, which subsequently attracts 3rd party sellers to Amazon’s marketplace. All of these factors lead to faster business growth for Amazon.
Amazon follows a cost leadership strategy, but so do many other online and offline retailers. Why then does Amazon outperform them?
- Low-cost structure. By mainly selling online, Amazon doesn’t incur huge costs related to running physical retail outlets. Online marketplaces also potentially allow for selling more units without any increase in marginal costs. Amazon constantly invests in both additional fulfillment centers and to existing centers to enable a reduction in order fulfillment times and shipping costs. These time and cost savings result in lower prices that are passed on to consumers.
- Selection. According to Retail TouchPoints[4], Amazon sells over 353 million of various products in its Amazon.com Marketplace. In comparison, Walmart offers over 75 million products[5] in its online shop, or around 21% of the number of products that Amazon offers. This vast difference in range is the reason why online customers are more likely to visit Amazon.com rather than Walmart’s e-shop.
- Third party sellers. Amazon’s business model includes accommodating third party sellers who are able to offer their own merchandise on Amazon’s sites and whose products therefore compete against Amazon’s. At the beginning, third party sellers were mainly attracted to the Amazon Marketplace because of the high traffic to its stores. Now the main drivers are such programs as ‘Fulfilled by Amazon’ and Prime. Third party sellers often offer products that are not available through Amazon’s retail division. In 2021, third party sellers accounted for 55% of all the products sold through the company’s online stores.[6] Amazon calculated that , third-party seller profits from selling on Amazon were between US$25 billion and US$39 billion, while Amazon was able to earn US$80.461 billion from the services provided to them.
Low prices, a huge product range and the vast number of third party sellers are all the key factors in improving the Amazon customer experience and in driving more traffic to their sites. Few companies can compete with Amazon in any of these areas.
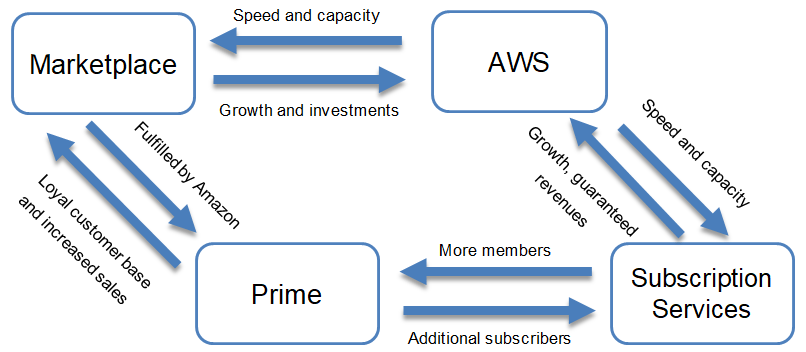
2. Synergies between Marketplace, Amazon Web Services, Prime and subscription services
Amazon is involved in 4 key businesses:
- Amazon Marketplace
- Amazon Web Services (AWS)
- Amazon Prime
- Subscription Services
All four Amazon offerings support each other and create benefits that would not be achieved if the businesses operated independently.
Figure 3. Amazon’s synergies
AWS was introduced in 2006 when Amazon realized it could sell its servers’ excess capacity to other enterprises. For Amazon as an online retailer, the key place to sell its goods is its website. To run an e-commerce website with millions of visitors each day the company had to invest heavily in its server infrastructure. These investments and the resulting server capacity have helped AWS to grow. In return, AWS provides two important elements for its sites:
- Speed. Page load speed is crucial for Amazon. Every 100ms of delay costs the company tens or hundreds of millions due to the lost customers. AWS helps to speed up the website’s load time, so that Amazon is able to serve each customer as quickly as possible. Subscription services also benefit from this. The content and especially, the video content is served very fast to the subscribers, increasing their satisfaction with the service.
- Capacity. During the peak times of Cyber Monday (the Monday after the Thanksgiving holiday in the U.S), Black Friday (the Friday after the Thanksgiving holiday), and in the several weeks leading up to Christmas, Amazon receives an overwhelming number of visitors to its sites. AWS’s huge capacity, which is not needed during the rest of the year, is employed during these peak times to help Amazon cope with the increased number of visitors.
In 2005, Amazon introduced the Amazon Prime subscription service, which offers access to Prime Videos, Prime Music, free one-day delivery, free two-day delivery and free same day delivery and many other benefits for a flat annual fee. As of December 2020, there are 200 million Amazon Prime members worldwide.[8] Prime users buy more merchandise and spend more on each item than regular users.[1] Marketplace helps to attract new visitors to Prime through its Fulfillment by Amazon program (FBA).
The FBA program allows third party sellers to place their products in Amazon’s warehouses, where Amazon takes responsibility for all logistics, customer service, order fulfillment and returns. This enables more products to become eligible for Amazon Prime, which is the key for the program to flourish. In addition, packaging and shipping costs are reduced when two or more items are shipped. As a result, Prime becomes more profitable and Amazon customer satisfaction increases.
Prime members also get an access to the Amazon’s prime content and subscription services. Amazon marketplace customers who are signing up for the Prime membership for faster deliveries and bigger discounts are more likely to consume the Amazon’s prime content and will get locked to the Amazon’s Prime membership even more. On the other hand, people who become Prime members due to the Amazon’s Prime content, will spend more on Amazon Marketplace due to the Prime membership benefits. Prime membership creates multiple benefits for every Amazon service and the company itself.
Synergies between Amazon’s Marketplace, AWS, Prime and subscription services are hardly quantifiable, but they provide some of the strongest competitive advantages any company could have.
3. Unmatched brand reputation in the retail sector
Amazon.com owns one of the most valuable brands in the world. The company, despite having a solely online presence until 2017 and being far behind the largest retailer in the world in terms of revenue, has an impressive brand reputation. Interbrand[8] and Forbes[9] have respectively listed Amazon.com as the 2nd and 4th most valuable brand in the world, at US$200.667 billion and US$135.4 billion. The brand was the fastest growing brand in terms of dollar value in both lists in 2020.
Brand value is closely related to a brand’s strength, awareness and reputation. These factors are much more important for online retailers than offline retailers. Amazon’s rivals are just a click away and if the company’s customers are not satisfied with the brand they can easily switch to another online retailer.
Amazon has a reputation as a huge online retailer offering the lowest prices on a vast range of merchandise, fast shipping, a comfortable shopping experience and great customer service. Strong brand awareness combined with the company’s positive reputation helps Amazon to both increase sales and introduce new products to the market without the need for huge advertising and marketing efforts. Few other online or offline retailers can effectively compete with Amazon’s brand.
4. Innovative fulfillment centers and distribution software reducing order fulfillment times and costs
Amazon is well known for both its innovation in order fulfillment and its huge network of fulfillment centers across the U.S., the U.K. and countries around the world. Fast and reliable order fulfillment is crucial for Amazon to succeed in the online retail business. In order to provide such fast and reliable fulfillment the company has to constantly improve its fulfillment centers and proprietary software to manage product receipt, storage, order-picking and shipment.
Amazon currently has 1561 [10] fulfillment/sortation centers, delivery stations and Prime Hubs and is planning to add a few hundred additional fulfillment centers over the next few years. The company uses over 200,000 robots in its fulfillment centers around the world [11] to help with the storing and retrieval of products in higher quantities and at a lower cost than ever before. In addition, Amazon uses advanced software to help monitor inventory levels and even to begin packing orders based on predictive algorithms.
Figure 4. The benefits of Amazon using robots for order fulfillment
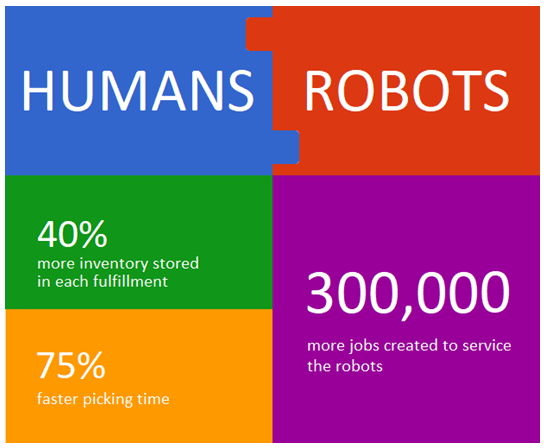
Amazon’s innovations in its fulfillment centers have led to the company having one of the fastest order fulfillment and shipping times in the distribution industry. It has reduced its costs significantly and ‘Fulfilled by Amazon’ is now one of the lowest priced order fulfillment and shipping services in the U.S., especially for the Amazon Marketplace sellers. [13]
No other retailer can match Amazon’s competitive advantage in order fulfillment.
5. Reliability and low prices of AWS make it one of the most attractive cloud computing services on the market
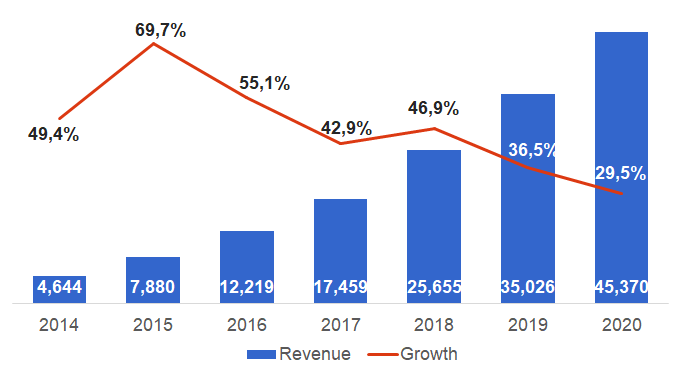
AWS is a collection of on-demand, pay-as-you-go cloud storage and computing services that are reliable, scalable and inexpensive. AWS, which was the fastest growing Amazon business for the last 5 years, except 2020, grew its revenue by 29.5% to US$45.370 billion in 2020.[1] While AWS still lags behind Amazon’s core retail business revenue, it has become one of the key businesses with its own reporting segment.
Figure 5. AWS growth 2014-2020 (revenue in US$ billions)
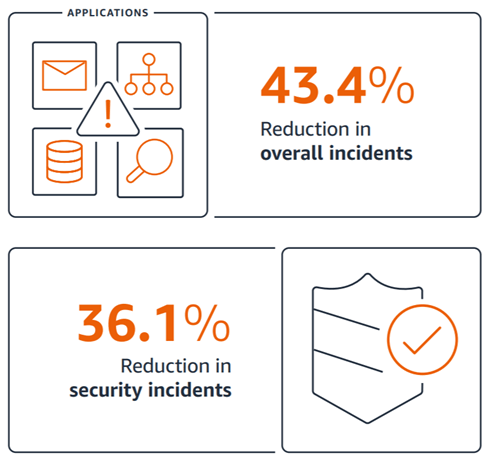
AWS’s key strengths are its reliability, scalability and inexpensiveness. According to AWS case study[14], AWS business customers report the following benefits of using the service:
- Cost Savings. Usually, increasing server capacity takes weeks and the costs of doing that are significant. Now, organizations using AWS can scale their IT resources in just a few hours for much less cost. AWS enables businesses to make decisions related to IT infrastructure faster and with fewer risks.[14]
- Staff Productivity. Businesses using AWS can move away from the day-to-day operational problems associated with managing IT infrastructure and spend more time developing new and improving current applications, which increases customer satisfaction. On average, organizations that move their infrastructure business to AWS, see 62% more productivity than the organizations that manage their own IT infrastructure.
- Business Agility. Faster deployment of new features and fewer errors result in increased development speed and lower IT costs for the company. Developers can start developing applications and introduce them faster when business choose AWS for their IT infrastructure needs.
- Operational Resilience. Businesses using AWS also benefit from fewer downtime occurrences, less time required to resolve the issues, increased security measures and an ability to predict the issues and prepare for them accordingly before they happened.
Figure 6. Business benefits using AWS
Reliability, scalability and inexpensiveness are the factors that so many businesses choose AWS over other cloud computing services, such as Microsoft Azure or Google Cloud. Constant innovation and introduction of various business tools that help developers to introduce applications faster or IT specialists to manage the infrastructure more efficiently, increases AWS reputation and competitiveness.
Weaknesses
1. Increasing long-term obligations-to-assets ratio
Amazon’s debt-to-asset ratio has risen significantly over the past few years and it is now one of the highest among its competitors.
Figure 7. Amazon’s and Wal-Mart’s long-term obligations and debt-to-asset ratios (debt in US$ billions)
| Company | 2016 | 2017 | 2018 | 2019 | 2020 |
|---|---|---|---|---|---|
| Total long-term debt | |||||
| Amazon | 20.301 | 45.718 | 50.708 | 75.376 | 101.406 |
| Wal-Mart | 36.015 | 30.045 | 43.520 | 43.714 | 41.194 |
| Long-term debt growth | |||||
| Amazon | 16.2% | 25.2% | 10.9% | 48.6% | 34.5% |
| Wal-Mart | (5.8)% | (16.6)% | 44.8% | 0.4% | (5.8)% |
| Debt/asset ratio | |||||
| Amazon | 24.3% | 34.8% | 31.2% | 33.5% | 31.6% |
| Wal-Mart | 18.1% | 14.7% | 19.8% | 18.5% | 16.3% |
Figure 7 reveals that Amazon’s debt level is growing fast, even faster than Wal-Mart’s debt. Its debt-to-asset ratio has also been increasing over the last few years.
Amazon’s debt level isn’t extremely high when looking at the figures alone. However, it could become a significant weakness if the company continues to grow by further building fulfillment centers or acquiring new businesses. Both activities require significant investments and are usually financed with debt.
2. Poor R&D capabilities leading to a weak patent portfolio
In addition to its retail distribution business, Amazon is manufacturing and selling its own range of consumer electronics devices such as Kindle, Fire tablet, Fire TV, Echo and Ring. In order for a company to succeed in the technology sector, it must innovate. Usually, the more a business spends on R&D, the more innovation it creates. Yet, this doesn’t apply for Amazon. According to Amazon’s financial report, the company is spending increasingly more on R&D activities.[1]
Figure 8. R&D spending by Amazon and its largest competitors (in US$ billions)
| Company | 2018 | Change from 2017 | As a % of revenues | 2019 | Change from 2018 | As a % of revenues |
|---|---|---|---|---|---|---|
| Amazon.com | 28.837 | 27.5% | 12.4% | 35.931 | 24.6% | 12.8% |
| Apple | 14.236 | 23% | 5% | 16.127 | 14% | 6% |
| Samsung Electronics | 16.003 | 11% | 7.7% | 17.326 | 8.2% | 8.8% |
| Microsoft | 14.726 | 13% | 13% | 16.876 | 15% | 13% |
| Alphabet (Google) | 21.419 | 28.8% | 15.7% | 26.018 | 21.5% | 16.1% |
Usually, high R&D spending results in a huge patent portfolio, which helps a company by preventing its innovations from being used by other companies and also protects it against patent lawsuits. Nonetheless, Amazon, which spent the largest amount on R&D in the world, has been registering relatively fewer patents than its competitors.
Figure 9. 2017-2019 utility patents granted to Amazon and its competitors in the U.S.
| Company | 2017 | 2018 | 2019 | Total |
|---|---|---|---|---|
| Amazon | 1,960 | 2,035 | 2,427 | 6,422 |
| Alphabet (Google) | 2,454 | 2,070 | 2,102 | 6,626 |
| Microsoft | 2,440 | 2,355 | 3,081 | 7,876 |
| Apple | 2,225 | 2,147 | 2,490 | 6,862 |
| Samsung Electronics | 5,810 | 5,836 | 6,469 | 18,115 |
Again, Amazon is behind its competitors in the technology sector, having been granted only 6,422 utility patents during 2017-2019, compared with Samsung Electronics, which totaled 18,115 utility patents over the same time period.
There are a few reasons for this. Amazon puts its R&D spending under ‘Technology and Content’ section, which also includes spending for content creation for the company’s subscription services. Amazon’s low patent number compared to its R&D spending could mean that the company actually spends very little for R&D from that amount and spends more on content creation. If the company actually spends a significant amount on R&D from the portion reported under ‘Technology and Content’ section, then it means that Amazon’s R&D capabilities are inferior compared to its rivals.
In order for Amazon to be able to better compete with its rivals in the future, it has to strengthen its R&D capabilities and patent portfolio. Otherwise, Amazon will be at a significant competitive disadvantage and will likely fail to grow its consumer electronics business.
3. Comparably few physical locations, limiting Amazon’s expansion potential
Recently, Amazon was a solely online retailer with no physical locations. In 2015, the company opened its first physical bookstore. As of March 2020, Amazon only has 23 bookstore locations, 23 Amazon 4-Star stores, 1 Amazon Go store and 6 pop-up locations across the U.S.[23] In 2017, Amazon acquired Whole Foods Market Inc. for US$13.2 billion and significantly expanded its grocery business, with an additional 500 locations across the U.S., Canada and United Kingdom.[1]
By acquiring Whole Foods and entering grocery brick and mortar business with its own brand, Amazon has diminished one of its major weaknesses (limited expansion potential for grocery business). Nonetheless, compared to other major retailers in the U.S. and in international markets, Amazon still lacks in retail locations.
Amazon’s online retail store has many advantages over the competitors. However, relying mostly on online presence also provides some of the following limitations:
- Sales of heavy and bulky items. Any item which can’t fit into a normal-sized post office (P.O.) box is considered by Amazon to be a large item. Amazon has a special policy regarding the shipment of over-sized and large items, they are treated differently to normal-size items. Bulky items are not eligible for Prime and for a good reason.[25] They take much longer to ship and their shipment is usually costly, both of which work against Amazon’s core selling proposition. That is why bulky items are not as popular on Amazon as they are in physical retail stores.
- Less impulse sales. Online retailers, especially Amazon, are getting better at enticing customers to buy more than they had planned, but they still lag behind offline retailers in this facet of retailing. According to a study done by A. T. Kearney[26], 40% of people make impulse purchases in a physical retail store, while only 25% of online shoppers do the same. The reasons that retail stores are capable of selling more impulse items are that they have more space to display the items, those items can be touched and tried on if necessary. and most importantly, they can be purchased and used instantly. Online retailers simply can’t offer those potential benefits to consumers.
Amazon is in the right direction to enter brick and mortar retail business, but the company should further increase its physical presence to capture more sales in the U.S. grocery market, which was worth US$695.76 billion in 2019.[27]
4. Very low margins on retail business
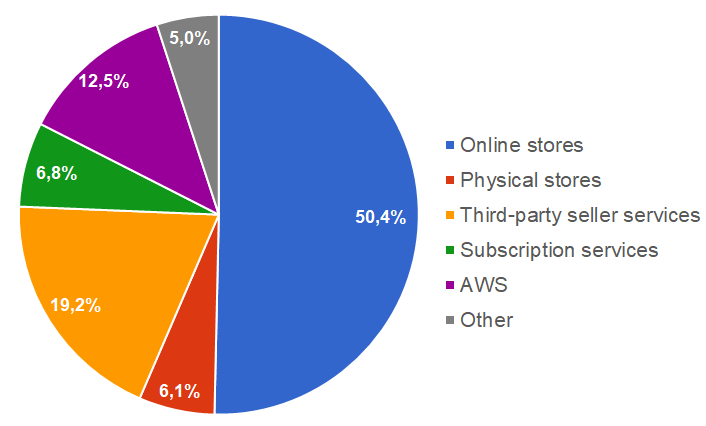
In 2019, Amazon earned US$280.522 billion in total revenues. Retail sales, both in online and physical stores, were US$158.439 billion or 56.5% of the total revenue. The rest of the revenue included revenue from the third-party seller services, subscription services, AWS and other revenue.
Figure 10. Amazon revenue breakdown by product
Despite, being the major source of the company’s income, the retail business has notoriously generated mostly losses over the company’s entire existence. Since the company’s first sales in 1995, the company has not generated any profit until 2003.[24] Since then, Amazon only sometimes earned profits on retail business worth billions. By our estimates, in 2019, the company earned little to zero profits on its retail business again.
Last year, Amazon’s net sales in North America and International segments totaled US$245.496 billion and an operating income was US$5.340 billion, excluding the sales and operating income from the AWS business. In addition to the retail sales, North America and International segments include the revenue from the third party seller services, subscription and advertising services, which often are much more profitable than the retail business. Considering that Amazon’s retail business generated US$158.439 for the company, we can estimate that it’s retail business generated US$3.446 billion in operating income at the most. It most likely generated losses, because Amazon’s International segment did result in US$1.693 billion operating loss and almost all of the International segment revenue come from the retail business.
In the past, Amazon’s low profitability was explained by the need to fuel its rapid expansion. Today, Amazon is huge and its capacity does not need to grow as fast as before. Amazon should streamline its operations to make its retail business, which generates the sales of US$158.439 billion a year, much more profitable.
Opportunities
1. Online grocery sales will reach US$59.5 billion by 2023
In 2019, U.S. consumers spent US$695.76 billion buying groceries.[27] Groceries are the second largest retail category in the U.S. in terms of sales, after automobiles. The grocery has been largely undisrupted by e-commerce until now. According to the data from Statista, online groceries sales had increased to US$28.7 billion in the U.S. in 2019.[28] In 2019, online grocery sales represented just 3.5% of the total U.S. grocery sales.[27][28] That’s a huge gap between the rest of e-commerce, which, according to DigitalCommerce360 statistics, accounted for 16% of total retail sales.[29]
Figure 11. E-commerce and online grocery sales as % of total retail and grocery sales (actual and forecast)
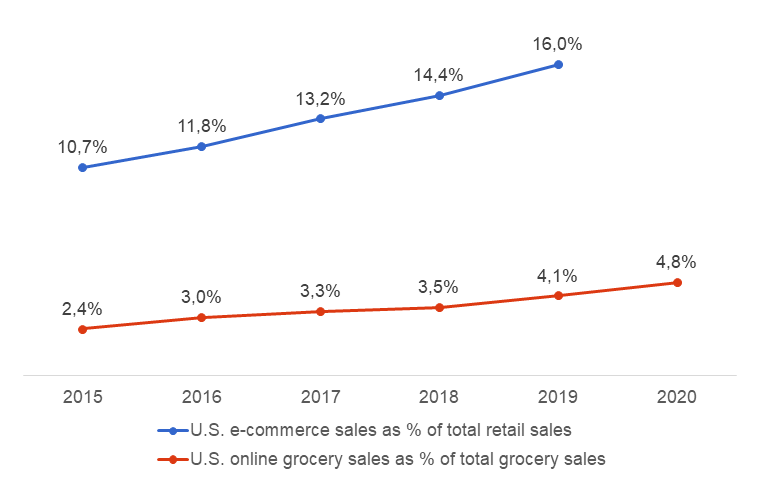
The data from Statista[28] forecast that online grocery ordering will grow fast in the future. The market is expected to reach 4.8%-5% of the total U.S. grocery sales with U.S. consumers spending over US$34 billion for groceries online in 2020 and over US$59 billion in 2023. We expect these numbers to be even higher due to the pandemic and the current and future travel restrictions or complete lockdowns imposed on the entire countries’ populations. Such restrictions would result in fewer store visits, but should significantly increase the online grocery sales.
Amazon has a great opportunity to capture a larger market share of the growing online grocery sales market in the U.S. via its AmazonFresh service and Whole Foods Market stores. AmazonFresh was introduced in 2007 and offers both online grocery ordering and home delivery and is now available in many areas across the U.S. and many international markets. After Acquiring Whole Foods Market, Amazon started grocery delivery to homes from some of the chains’ stores.
2. Increasing demand for voice-controlled virtual assistants in home devices
Apple was the first company to launch its own voice-activated virtual assistant (called Siri) back in 2011. This gave Apple’s devices a competitive advantage over its rivals, which didn’t have their own virtual assistants. However, its competitors soon caught up and now Amazon has Alexa (introduced in 2014), Google offers Assistant and Microsoft offers Cortana as its virtual assistant (VA).
While smartphones will remain the primary VA sources, the current trend is to let the VA into homes and third-party hardware. For example, Amazon has launched Amazon Echo, a speaker that listens to your voice and executes the commands. It allows you to control the connected apps and devices through your voice. Google has similar devices, but with greater capabilities due to their Assistant’s connection to a wider range of devices. Amazon also allows its virtual assistant to be added to third party hardware. This allows Amazon to widen its VA product ecosystem. Hardware can be connected and controlled through only one VA and accessed almost anywhere in a house.
Research from Markets&Markets reveals that the market for intelligent virtual assistants will be worth over US$25.63 billion by 2025.[30] While it’s not the biggest market opportunity for Amazon, the company could increase its efforts on Alexa’s development. This would strengthen the company’s ecosystem and provide a better user experience.
3. Growing market for subscription-based video on demand services
Streaming video services have been growing significantly in demand for the last 10 years. In 2018, the number of subscriptions to online video services around the world increased to 613.3 million and for the first time surpassed cable subscriptions (556 millions).[31]
There are 3 distinct video streaming business models in the market now:[32]
- Advertising video on demand (AVoD), like, YouTube;
- Transactional video on demand (TVoD), like, iTunes;
- Subscription video on demand (SVoD), like, Netflix.
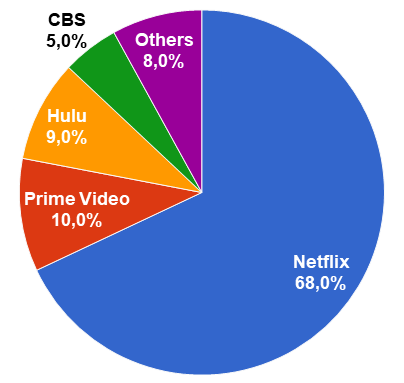
The highest grossing category is SVoD, in which, Amazon’s Prime Video subscription service also competes for a market share. SVoD market is dominated by Netflix,[33] which had around 61.4 million subscribers worldwide at the end of 2019, compared to Prime Video’s [34] 50.23 million subscribers worldwide in 2018.
The market for SVoD is growing fast with subscriptions expected to grow to 950 million worldwide and to 127.4 million in the U.S. by 2024. In the U.S. alone, the market is expected to be worth US$12.968 billion in 2024. Even faster growth is expected to be in the markets outside the U.S.[35]
Figure 12. Top U.S. SVoD services by market share in 2018
Original content helps to attract more subscribers to the platform more than any other factor. In order to increase the market share and capture more revenue from the growing SVoD market, Amazon Prime should start creating and introducing more of its own original movies, shows and series.
4. The Internet of Things (IoT) market is expected to grow significantly over the next decade
According to Gartner [37], the Internet of Things is “is the network of physical objects that contain embedded technology to communicate and sense or interact with their internal states or the external environment.”. In other words, all devices like cars, smartphones, computers, refrigerators, dishwashers, dryers and any other devices that are connected through Wi-Fi or Bluetooth can be called the IoT. The IoT market is a very lucrative market, in which all technology companies fiercely compete to gain market share.
The number of devices connected to the internet is projected to increase to 43 billion by 2023, an almost threefold increase from 2018.[38] Another forecast predicts that the worldwide market for the IoT will grow from US$193.6 billion in 2019 to US$657.31 billion by 2025.[39]
Amazon has many opportunities in the growing IoT market. The company already has many products that connect to the internet or each other. It also introduced AWS IoT a web platform that allows to connect and control things securely, collect their data, install software for them and get valuable insight from the data collected from the devices.[40] AWS IoT services and solutions offer many benefits in managing IoT devices and if the Amazon is able to make its AWS IoT platform the IoT industry’s standard, it could dominate the internet of things software market.
The benefit for Amazon if they can achieve this is that the company will gain even more information (one of the key company’s competitive advantages) about users than it already has, which will lead to even better customer targeting. Amazon may also be able to license the new OS and introduce a whole new ecosystem of products to increase revenue.
Threats
1. Wal-Mart’s efforts to establish itself as a leading online retailer
The retail sales of physical stores compared to e-commerce sales are growing very slowly. Many retail companies, including Amazon’s key rival Wal-Mart, are making huge efforts to establish themselves as electronic commerce retailers. In 2019, Wal-Mart’s comparable store sales in the U.S. grew by only 1.6%, while the total sales of the Walmart U.S. grew by 4%. Most of the additional growth was achieved through e-commerce sales, which in 2019 grew by 40% nearly doubling the sales of Walmart U.S. eCommerce in the last two years.[5] Wal-Mart now has e-commerce websites in 10 countries and competes with Amazon in the U.S., U.K., Canada, China and Japan.
Wal-Mart cannot compare to Amazon.com yet, but the company is significantly expanding its e-commerce operations:
- New fulfillment centers. As of March, Wal-Mart has 33 dedicated U.S. fulfillment centers, 90 dedicated international fulfillment centers and 6 Sam’s Club fulfillment centers and plans to add many new facilities over the next few years. In total, the company has 129 fulfillment centers around the world dedicated to e-commerce only, up from 39 dedicated fulfillment centers in January 2017.[5] The company can easily convert its existing distribution centers or superstores to new fulfillment centers when needed, without significant additional costs.
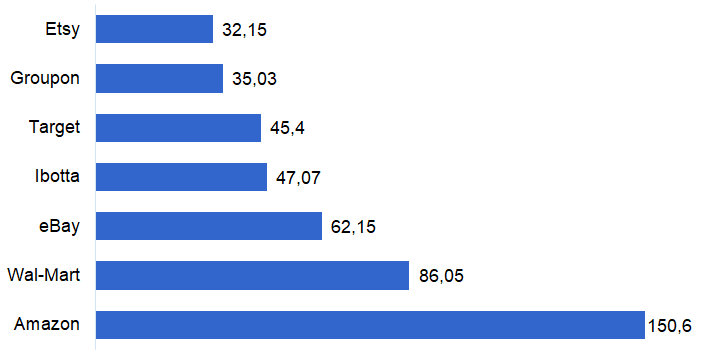
- Second most popular retail app. Wal-Mart has built one of the fastest-growing retail apps, which now has over 86.05 million users. It is the 2nd most popular retail app after Amazon’s.[41] Unlike other traditional retailers, Wal-Mart has figured out how to offer a useful app and to attract visitors to both its online and offline stores. Figure 13. Most popular retail apps in the U.S. (users in millions)

- Grocery deliveries. Wal-Mart’s online grocery shopping service has been increasing in popularity over the last few years, and the company has announced that it will expand the service to more cities in the U.S. Currently, the company offers a grocery delivery service in over 800 locations in the U.S.[5] Wal-Mart’s grocery delivery service directly competes with AmazonFresh and it does that successfully.
- In-store pick up. Unlike Amazon, Wal-Mart can offer in-store pick up of its items that have been bought online. Walmart offers grocery pickup at more than 2,100 locations in the U.S. and the company has clear advantage in this area over Amazon, which has considerably fewer grocery pickup locations.[5] In-store pick up doesn’t cost anything for either a shopper or Wal-Mart, saving both delivery costs and time.
Although Walmart can’t match Amazon.com in e-commerce, it is outgrowing Amazon in online grocery delivery business and has some of the strengths that Amazon doesn’t.
2. Risk of data breaches
Amazon is the world’s largest online retailer, having over 124 million Prime members and hundreds of millions more non-Prime members.[42] The company collects credit or debit card information from every customer who makes a purchase on its sites. Amazon stores that credit/debit card data and protects it from theft. Nonetheless, data breaches can occur and customer data does get stolen and exposed from time to time.
According to the Identity Theft Resource Center, instances of personal information theft are growing. In 2019, 1,427 identity thefts were reported, an increase of 17% over 2018.[43] Since 2005, billions of records of personal information have been stolen, with significant associated damages incurred by both affected businesses and their customers.
Some of the biggest credit/debit card information thefts have affected e-commerce giants such as eBay, Wal-Mart and even Amazon. All of these companies have lost customers and sales because of it. With the growing number of data breaches, there is always a potential risk of Amazon being breached again.
3. Amazon could potentially be sued for infringing intellectual property rights
In addition to its retail business, Amazon is also a technology company, an industry in which nearly every large company is involved in lawsuits over patent or other intellectual property infringement. Amazon, sometimes unknowingly, could be infringing others’ patents and sued as a result. Lawsuits are costly and they damage a company’s brand. That is why Amazon identifies this as the key risk to their business:
“Other parties also may claim that we infringe their proprietary rights. We have been subject to, and expect to continue to be subject to, claims and legal proceedings regarding alleged infringement by us of the intellectual property rights of third parties.
Such claims, whether or not meritorious, may result in the expenditure of significant financial and managerial resources, injunctions against us, or the payment of damages, including to satisfy indemnification obligations. We may need to obtain licenses from third parties who allege that we have infringed their rights, but such licenses may not be available on terms acceptable to us or at all. In addition, we may not be able to obtain or utilize on terms that are favorable to us, or at all, licenses or other rights with respect to intellectual property we do not own. These risks have been amplified by the increase in third parties whose sole or primary business is to assert such claims.”[1]
4. The rising U.S. dollar exchange rate could negatively affect the company’s revenue and profits
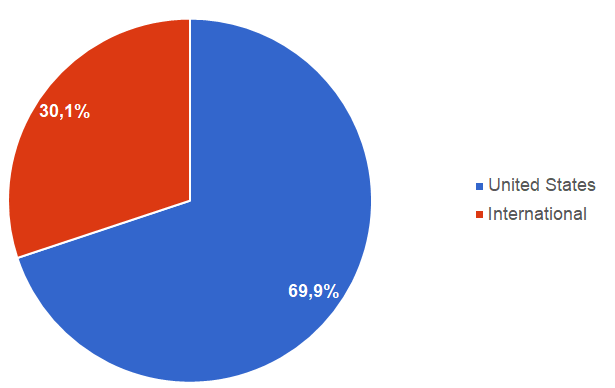
Currency exchange rates affect every multinational company, including Amazon. In 2019, the company earned US$86.866 billion or 30.1% of its revenue outside of the U.S.[1]
Figure 14. Amazon revenue geographic breakdown
This means that Amazon currently receives a large share of its revenue and profits in currencies other than the U.S. dollar. Other currencies therefore have to be converted to the U.S. dollar in order for the company to be able to calculate its total revenue and transfer its profits back to the U.S. This is where a strong U.S. dollar, or in other words, the currently rising U.S. dollar exchange rate damages company’s financial position. In its financial report, Amazon mentioned multiple times that its sales were unfavorably impacted by the weakness in foreign currencies compared to U.S. dollar.
A strong dollar does not only decrease the profits from foreign countries but also makes the company’s products more expensive and less attractive to the customers abroad.
In 2019, the U.S. dollar increased in value against other currencies for the second consecutive year. Current forecasts indicate that the U.S. dollar exchange rate may continue to increase against other currencies in 2020 as well.[44] This means that Amazon’s products will become even pricier abroad and its revenue and profits from outside the country are likely to decrease when converted to U.S. dollars.
Summary
There are many factors that helped Amazon.com to become the largest online marketplace. The first one being, the supplemental businesses, like Amazon Web Services and Amazon Prime, that simply made the marketplace better and also increased the company’s revenue significantly. The second factor is a long-term thinking. The company would never have made it this far if it tried to operate for short-term or even mid-term. Amazon marketplace is still unprofitable business, but the investors seem to care little about it, seeing such a huge growth potential.
Amazon’s marketplace business should invest more into technological advancements that would allow the company to collect, package, distribute and deliver the items to customers faster and cheaper. Amazon could also streamline its operations, so it would become more profitable than it is now.
Amazon’s AWS business is doing extremely well and the company should separate AWS from Amazon.com, to let AWS grow organically from the marketplace. Both businesses should still keep close relationship to benefit from the synergies they create.
As for the weaknesses, Amazon should improve its business policies regarding warehouse workers’ conditions. Bad publicity doesn’t help Amazon, but hinder its performance. Amazon’s limited physical presence is a weakness, when compared to Walmart or other major brick-and-mortar businesses, but the company shouldn’t focus too much on addressing it. Low margins or incompetence in R&D investments will make more damage in the future if not addressed now.
There are quite a few opportunities Amazon could pursue and the largest ones are IoT market and voice controlled assistants market. Both opportunities would represent company’s shift from low margin retail business to high margin software business.
Amazon also already pursues online grocery opportunity, which is, in my opinion, is the next biggest growth opportunity for the company right now.
Few threats could really hurt Amazon’s business. Data breaches will likely occur and will hurt the company’s business but not in terms of billions of U.S. dollars. In the U.S., Walmart is the most serious Amazon’s online competitor. Walmart is competing very successfully in online grocery ordering and delivery business and its general e-commerce operations are growing as well.
Sources
- Amazon.com, Inc. (2021). Form 10-K for the Fiscal Year Ended December 31, 2020. Available at: https://d18rn0p25nwr6d.cloudfront.net/CIK-0001018724/336d8745-ea82-40a5-9acc-1a89df23d0f3.pdf Accessed May 23, 2021
- Fareeha, A at Digital Commerce 360. (2021). US e-commerce sales grow 44.0% in 2020. Available at: https://www.digitalcommerce360.com/article/us-ecommerce-sales/ Accessed May 23, 2021
- Wingo, S. (2009). Amazon’s Wheel of Growth. Available at: http://seekingalpha.com/article/121955-amazons-wheel-of-growth Accessed May 23, 2021
- Retail TouchPoints (2021). How Many Products Does Amazon Carry?. Available at: https://retailtouchpoints.com/resources/how-many-products-does-amazon-carry Accessed May 23, 2021
- Walmart (2018). Walmart Inc 2018 Q&A Session with the Investment Community. Available at: https://corporate.walmart.com/media-library/document/2018-shareholders-q-a-session-with-the-investment-community-transcript/_proxyDocument?id=00000163-cb67-db80-a3ff-cb6fe66f0000 Accessed May 23, 2021
- Statista (2021). Percentage of paid units sold by third-party sellers on Amazon platform as of 1st quarter 2021. Available at: https://www.statista.com/statistics/259782/third-party-seller-share-of-amazon-platform/ Accessed May 23, 2021
- Amazon.com, Inc. (2021). Amazon Annual Report 2020. Available at: https://s2.q4cdn.com/299287126/files/doc_financials/2021/ar/Amazon-2020-Annual-Report.pdf Accessed May 23, 2021
- Interbrand (2021). Best Global Brands 2020. Available at: https://www.interbrand.com//best-brands/ Accessed May 23, 2021
- Forbes (2021). The World’s Most Valuable Brands. Available at: http://www.forbes.com/powerful-brands/list/ Accessed May 23, 2021
- MWVPL International (2021). Amazon Global Fulfillment Center Network. Available at: http://www.mwpvl.com/html/amazon_com.html Accessed May 23, 2021
- Del Rey, J. (2019). How robots are transforming Amazon warehouse jobs — for better and worse. Available at: https://www.vox.com/recode/2019/12/11/20982652/robots-amazon-warehouse-jobs-automation Accessed May 23, 2021
- About Amazon (2021). What robots do (and don’t do) at Amazon fulfilment centres. Available at: https://www.aboutamazon.co.uk/amazon-fulfilment/what-robots-do-and-dont-do-at-amazon-fulfilment-centres Accessed May 23, 2021
- Marsan, J. (2021). Order Fulfillment Services: Who’s The Best? Available at: http://fitsmallbusiness.com/order-fulfillment-services/ Accessed May 23, 2021
- Amazon Web Services (2019). Business Value on AWS. Available at: https://pages.awscloud.com/rs/112-TZM-766/images/Business%20Value%20on%20AWS%20EN.pdf Accessed May 23, 2021
- AWS (2019). Realizing business value with AWS. Available at: https://d1.awsstatic.com/executive-insights/en_US/infographic-realizing-business-value-with-aws.pdf Accessed May 23, 2021
- Walmart Inc. (2019). Form 10-K for the fiscal year ended January 31, 2019. Available at: http://d18rn0p25nwr6d.cloudfront.net/CIK-0000104169/b23b2787-eb44-4e0b-82bd-fca01f140a3e.pdf Accessed March 16, 2020
- Apple Inc. (2019). Form 10-K for the fiscal year ended September 28, 2019. Available at: http://d18rn0p25nwr6d.cloudfront.net/CIK-0000320193/1a919118-a594-44f3-92f0-4ecca47b1a7d.pdf Accessed March 16, 2020
- Microsoft Corporation (2020). Annual Report 2019. Available at: https://www.microsoft.com/investor/reports/ar19/index.html Accessed March 16, 2020
- Alphabet Inc. (2020). Form 10-K for the fiscal year ended December 31, 2019. Available at: https://abc.xyz/investor/static/pdf/20200204_alphabet_10K.pdf?cache=cdd6dbf Accessed March 16, 2020
- Samsung Electronics Co., Ltd. (2019). Consolidated Financial Statement of Samsung Electronics Co., Ltd. and Its Subsidiaries. Available at: http://d18rn0p25nwr6d.cloudfront.net/CIK-0000320193/1a919118-a594-44f3-92f0-4ecca47b1a7d.pdf Accessed March 16, 2020
- U.S. Patent and Trademark Office (2020). Ranked List of Organizations with 1000 or More Patents Granted During the Period, as Distributed Either or Both. Available at: https://www.uspto.gov/web/offices/ac/ido/oeip/taf/all_tech.htm Accessed March 16, 2020
- Statista (2020). Companies with the most U.S. patents granted to them in 2019. Available at: https://www.statista.com/statistics/274825/companies-with-the-most-assigned-patents/ Accessed March 16, 2020
- Amazon.com (2020). Amazon Physical Store Locations. Available at: https://www.amazon.com/b/ref=s9_acss_bw_cg_AMZBOOKS_1a1_w?node=17608448011&pf_rd_m=ATVPDKIKX0DER&pf_rd_s=merchandised-search-1&pf_rd_r=D5J5TEB30NRKXAWTQEX6&pf_rd_t=101&pf_rd_p=096fc6ba-011a-415f-ac91-55b3e6869365&pf_rd_i=13270229011 Accessed March 16, 2020
- Hansel, S. (2004). Amazon Reports First Full-Year Profit. Available at: http://www.nytimes.com/2004/01/28/business/technology-amazon-reports-first-full-year-profit.html Accessed March 16, 2020
- Amazon.com (2020). Shipping Large or Bulky Items. Available at: https://www.amazon.com/gp/help/customer/display.html/ref=hp_left_v4_sib?ie=UTF8&nodeId=201910290 Accessed March 16, 2020
- Market Wired (2013). A.T. Kearney Study Finds Brick & Mortar Stores Still Key to Consumers in the Omni channel World. Available at: https://finance.yahoo.com/news/t-kearney-study-finds-brick-140000556.html Accessed March 16, 2020
- YCharts (2020). US Grocery Store Sales. Available at: https://ycharts.com/indicators/grocery_store_sales Accessed March 16, 2020
- Statista (2020). Online grocery shopping sales in the United States from 2018 to 2023. Available at: https://www.statista.com/statistics/293707/us-online-grocery-sales/ Accessed March 16, 2020
- Young, J. from DigitalCommerce360 (2020). US ecommerce sales grow 14.9% in 2019. Available at: https://www.digitalcommerce360.com/article/us-ecommerce-sales/ Accessed March 16, 2020
- Grand View Research (2019). Intelligent Virtual Assistant (IVA) Market Size, Share & Trends Analysis Report. Available at: https://www.businesswire.com/news/home/20190822005478/en/Global-Intelligent-Virtual-Assistant-IVA-Market-2019-2025 Accessed March 16, 2020
- Motion Picture Association of America (2018). 2018 Theme Report. Available at: https://www.motionpictures.org/wp-content/uploads/2019/03/MPAA-THEME-Report-2018.pdf Accessed March 16, 2020
- Pymnts (2019). Deep Dive: Times Are Changing For The Subscription Video Streaming Market. Available at: https://www.pymnts.com/subscription-commerce/2019/changing-video-streaming-services-market/ Accessed March 16, 2020
- Statista (2020). Number of Netflix paying streaming subscribers in the United States from 3rd quarter 2011 to 4th quarter 2019. Available at: https://www.statista.com/statistics/250937/quarterly-number-of-netflix-streaming-subscribers-in-the-us/ Accessed March 16, 2020
- Statista (2020). Number of Amazon Video subscribers in the United States from 2017 to 2024. Available at: https://www.statista.com/statistics/648541/amazon-prime-video-subscribers-usa/ Accessed March 16, 2020
- Statista (2020). Video Streaming (SVoD). Available at: https://www.statista.com/outlook/206/109/video-streaming–svod-/united-states Accessed March 16, 2020
- Parrot Analytics (2019). United States SVOD market share trends based on audience demand for digital originals. Available at: https://www.parrotanalytics.com/insights/united-states-svod-market-share-trends/ Accessed March 16, 2020
- Gartner (2020). Internet of Things. Available at: http://www.gartner.com/it-glossary/internet-of-things/ Accessed March 16, 2020
- Dahlqvist, F., Patel, M., Rajko, A. and Shulman, J. at McKinsey & Company (2019). Growing opportunities in the Internet of Things. Available at: https://www.mckinsey.com/industries/private-equity-and-principal-investors/our-insights/growing-opportunities-in-the-internet-of-things Accessed March 16, 2020
- Mordor Intelligence (2020). Internet of Thins Market – Growth, Trends and Forecast (2020 – 2025). Available at: https://www.mordorintelligence.com/industry-reports/internet-of-things-moving-towards-a-smarter-tomorrow-market-industry Accessed March 16, 2020
- AWS (2020). AWS IoT. Available at: https://aws.amazon.com/iot/ Accessed March 16, 2020
- Statista (2020). Most popular mobile shopping apps in the United States as of September 2019, by monthly users. Available at: https://www.statista.com/statistics/579718/most-popular-us-shopping-apps-ranked-by-audience/ Accessed March 16, 2020
- Statista (2020). Number of Amazon Prime users in the United States from 2018 to 2022. Available at: https://www.statista.com/statistics/504687/number-of-amazon-prime-subscription-households-usa/ Accessed March 16, 2020
- Identity Theft Resource Center (2020). Identity Theft Resource Center’s Annual End-of-Year Data Breach Report Reveals 17 percent Increase in Breaches Over 2018. Available at: https://www.idtheftcenter.org/identity-theft-resource-centers-annual-end-of-year-data-breach-report-reveals-17-percent-increase-in-breaches-over-2018/ Accessed March 16, 2020
- Robinson, P. et al. (2020). US Dollar Soars, Wall Street Confirms Bear Market, Gold Prices Drop. What Now? Available at: https://www.dailyfx.com/forex/fundamental/forecast/weekly/title/2020/03/15/US-Dollar-Soars-Wall-Street-Confirms-Bear-Market-Gold-Prices-Drop.-What-Now.html Accessed March 16, 2020