
This Apple SWOT analysis reveals how one of the most successful world’s companies used its competitive advantages to become the dominant player in the tech industry.
It identifies all the key strengths, weaknesses, opportunities and threats that affect the company the most. If you want to find out more about the SWOT of Apple, you’re in the right place.
For more information on how to do a SWOT analysis please refer to our article.
Keep reading.
Company Overview
| Name | Apple Inc. |
|---|---|
| Founded | April 1, 1976 |
| Logo |  |
| Industries served | Computer hardware (iMac, iMac Pro, MacBook, MacBook Pro, MacBook Air) Software (iOS, iPadOS, MacOS, watchOS, tvOS, Safari, iWork, iMovie) Consumer electronics (iPhone, iPad, Apple TV, Apple Watch, AirPods, HomePod, Beats) Internet Services (iCloud, Apple Pay, App Store, Mac App Store, TV App Store, Book Store, Apple Music) |
| Geographic areas served | Worldwide – 509 retail stores in 25 countries (271 stores in the U.S. 238 stores in other 24 countries) and online stores in over 100 countries[2] |
| Headquarters | Cupertino, California, United States |
| Current CEO | Tim Cook |
| Revenue (US$) | $391.035 billion (2024) |
| Net Income (US$) | $93.736 billion (2024) |
| Employees | 164,000 (2024) |
| Main Competitors | Samsung Electronics Co., Ltd., Alphabet Inc., Amazon.com, Inc., Huawei Technologies Co., Ltd. International Business Machines Corporation, Cisco Systems, Inc., Microsoft Corporation, Dell Inc., LG Electronics, Lenovo Group Limited, Sony Corporation and many other computer hardware, computer software, consumer electronics and internet companies. |
Business Description
Apple Inc., established in 1977, is the largest technology company by revenue and one of the most valuable companies, both in terms of market capitalization and brand value, in the world.[3] The company has revolutionized the smartphone market and has created one of the most iconic brands in history.
Apple has built its business by selling and manufacturing computer hardware and software, but experienced significant growth and success by entering consumer electronics market with iPod, iPad and iPhone products.
The company designs, manufactures and markets smartphones, tablets, personal computers, wearables and accessories, and offers many related services including financial services.
The main company’s product is iPhone, which runs on Apple’s iOS operating system and accounts for 54.7% of the total company’s revenue.[1] In 2019, the company introduced three new iPhones: iPhone 11, iPhone 11 Pro and iPhone 11 Pro Max. Mac products are the second largest company’s product category by revenue, generating 9.9% of the total company’s revenue.[1]
Mac products include MacBook Air, Mac mini and Mac Pro and run macOS operating system. iPad category, which includes iPad, iPad Pro, iPad Air and iPad mini products, accounts for 8.2% of the total Apple’s revenue. The rest of the company’s products include wearables, home and accessories, which account for another 9.4% of the revenue and is the fastest growing Apple’s product category, growing by 41% in 2019.
In addition to the consumer electronics and computer hardware products, Apple is offering many services to its customers, including:
- Digital Content Stores. The company operates digital content stores that allow customers to discover and download applications and digital content, including music, videos, books, games and podcasts.
- Subscription based services. Apple’s services like Apple Music and Apple TV+.
- AppleCare services. AppleCare is a fee-based service that provides additional coverage of phone hardware repairs, accidental damage and even theft.
- Other services. These services include iCloud, licensing, Apple Card, Apple Pay and Apple News+.
Services generated 17.8% of the company’s revenue and was the second fastest growing category for Apple, growing 16% in 2019.[1]
Apple operates and sells its products in over 100 countries, but the U.S. China, the U.K. Canada and Australia are the most important markets. In 2019, the company’s net sales through its direct (sales in company’s 508 stores in 25 countries and sale through online stores) and indirect distribution (sales made by third-party sellers) channels accounted for 31% and 69%, respectively.[1]
Apple competes in a highly competitive industry and has to continuously perform at its best to be able to stay ahead of its competition. Apple competes primarily on price, product and service features, quality and reliability, design innovation, a strong third-party software and accessories ecosystem.
There are many large and well-positioned rivals in the industry, so a fierce competition requires constant innovation and taking advantage of the arising opportunities.
Apple SWOT Analysis
| Strengths | Weaknesses |
|---|---|
| 1. Unique ability to design and develop proprietary hardware, software, applications and services 2. Powerful brand supported by strong advertising and marketing capabilities 3. One of the most loyal customer base in every major product market where the company operates in 4. High degree of vertical integration 5. Efficient research and development (R&D) spending | 1. Over-reliance on iPhone sales as a major revenue source 2. Declining market share in the largest smartphone market (China) 3. Few successful innovations introduced over the past few years |
| Opportunities | Threats |
|---|---|
| 1. Augmented and virtual reality markets will be worth US$104 billion by 2023 2. Increasing demand for voice-controlled virtual assistants in home devices 3. Wearable medical device market will be worth US$62.82 billion by 2025 | 1. Smartphones and tablets are becoming a commodity, which could impact the company’s gross margins 2. Growing number of attacks on the company’s information technology systems 3. New patent infringements resulting in negative publicity affecting the company’s reputation 4. The rising U.S. dollar exchange rate could negatively affect the company’s revenue and profits |
Strengths
1. Unique ability to design and develop proprietary hardware, software, applications and services
Apple Inc.’s ability to design and develop its own hardware, software, applications and services allows the company to introduce unique, innovative and easy-to-use products and solutions for its customers.
Unique, innovative and easy-to-use products and services that integrate seamlessly into one Apple ecosystem are the reasons why customers buy Apple’s premium products and enjoy using them. In other words, it creates a competitive advantage no other company can match.
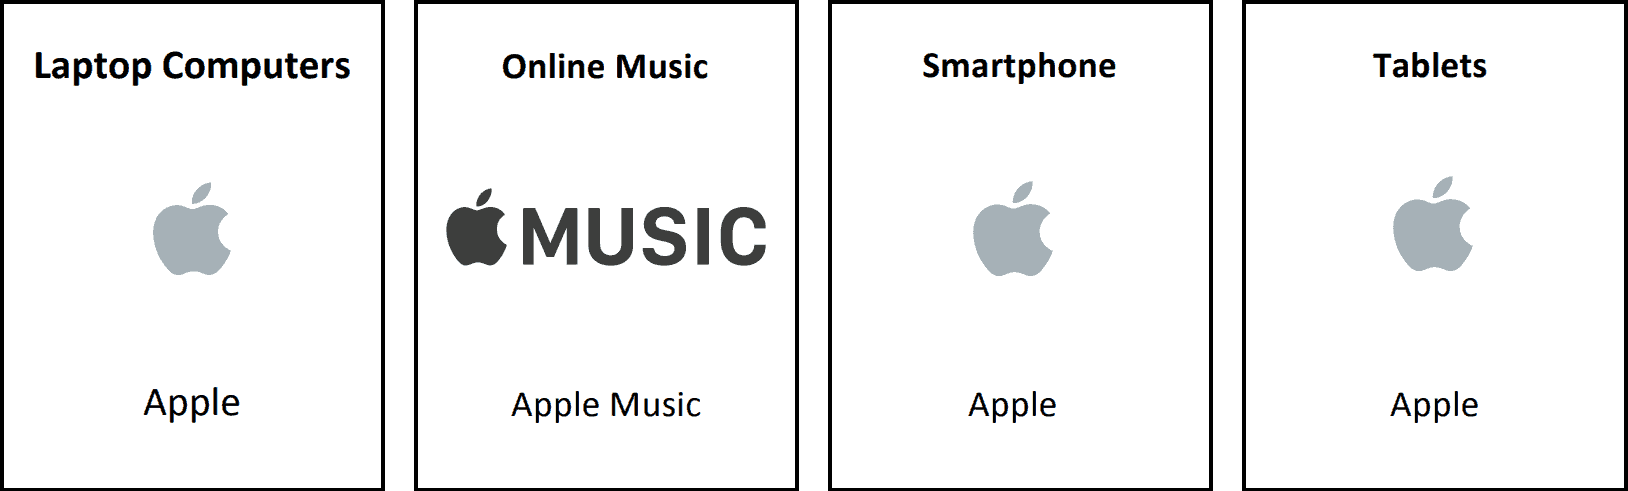
Figure 1. Apple’s product ecosystem

Apple’s product ecosystem is comprised of:
- Hardware products. Products including iPhone, Mac computers, iPad, AirPods, Apple TV, Apple Watch and other computer hardware as well as consumer electronics.
- Software. Apple provides operation systems for every product category it sells. The main operation systems that go with Apple products are iOS, macOS, iPadOS, watchOS and tvOS.
- Application software. Includes applications such as iLife, iWork, iMovie, Safari, Final Cut Pro, Apple Books and other applications which enable users to use Apple products for work or entertainment.
- Services. The company offers many service to its users, including: App Store, Apple Music, Apple News+, Apple TV+, Apple Arcade, Apple Card, Apple Pay, iCloud, AppleCare, licensing and many other services.
Apple’s ecosystem is the result of the company’s ability to design a wide variety of integrated proprietary hardware, software, applications and services.
Many of Apple’s competitors have tried and still try to imitate the success of Apple’s product ecosystem, but fail due to not having strong capabilities in designing, manufacturing and developing both hardware and software, applications and services.
Samsung Electronics, Apple’s strongest competitor, lacks a comprehensive OS and has very few apps and services to offer for its customers. Google, Apple’s second largest competitor is very good at software, application software and services, but has only developed a few unsuccessful hardware products.
Except for Google and Samsung Electronics, few other companies could seriously attempt to challenge Apple’s competitive advantage.
2. Powerful brand supported by strong advertising and marketing capabilities
Apple’s brand is the world’s most valuable and recognizable brand. According to Interbrand[4] and Forbes[5], the Apple brand is worth US$234.241 billion and US$205.5 billion, respectively. Brand value is closely related to its recognition, meaning that Apple is also one of the world’s most recognizable brands. Their brand recognition is supported by its vast product ecosystem.
Moreover, Apple has a reputation of developing highly innovative, well designed, and well-functioning products, as well as for delivering a great customer experience and sound financial performance.
The company has been able to achieve such strong brand recognition and reputation through its advertising and marketing capabilities. For over 30 years, Apple has been significantly relying on an external advertising agency TBWA/Chiat/Day help for launching its marketing and advertising campaigns.[6] These campaigns resulted in two very well-known advertisements – ‘1984’ and ‘Think Different’ and helped Apple to create an iconic brand image. Recently, the company has focused its efforts to strengthening its own in-house advertising and marketing teams by attracting a lot of new talented people to the internal agency.[6] This should result in lower costs and ever stronger marketing and advertising capabilities.
Apple’s excellence in creating spectacular marketing campaigns, its superior advertising capabilities, premium quality products and ability to deliver an excellent customer experience has allowed the company to build the most powerful brand in the world.
3. One of the most loyal customer base in every major product market where the company operates
Apple enjoys a very loyal customer base, considering that it doesn’t even have a loyalty program. Customers praise the company’s products for their innovation, design, ease-of-use, reliability and the status they convey. This is why they continue to buy and use Apple’s products even when there are better or cheaper options available in the market.
Apple’s retention rates in the smartphone market are the highest among its major rivals. According to BankMyCell, Apple retains 74.6% of its customers, compared to Samsung’s retention rate of 63.9% and LG’s 40.7%.[7]
Figure 2. Retention Rates in The Smartphone industry

Apple also enjoys the most loyal customer base in the tablet market, where the company was able to grow its market share significantly even when the market declined slightly.
Brand Keys, a consultancy agency, issues a “Customer Loyalty Engagement Index” study each year. It examines the world’s top brands in many industries and how loyal customers are to these brands. According to their latest study,[8] Apple’s brand enjoys the most loyal customer base in the tablet market. The company held this position for over 5 years. From 2014 to 2017, Apple also had the most loyal customer base in the smartphone and laptop markets as revealed by the same customer loyalty engagement study each year.[9][10][11][12] Although the company has lost the top loyalty position in these markets, it still has some of the most loyal customers in every market it operates.
Figure 3. Brand Keys’ Customer Loyalty Engagement Index (Apple’s market leader positions 2014-2017)
Customer loyalty is a key to every technology company’s success. Apple’s ability to retain its customers and do it so well brings it a competitive advantage no rival can match.
4. High degree of vertical integration
Apple is a vertically integrated company. Instead of growing by acquiring its competition (horizontal integration), the company chose to grow by venturing into other activities along the industry value chain.
Figure 4. Smartphone Industry Value Chain and Apple’s Role within it
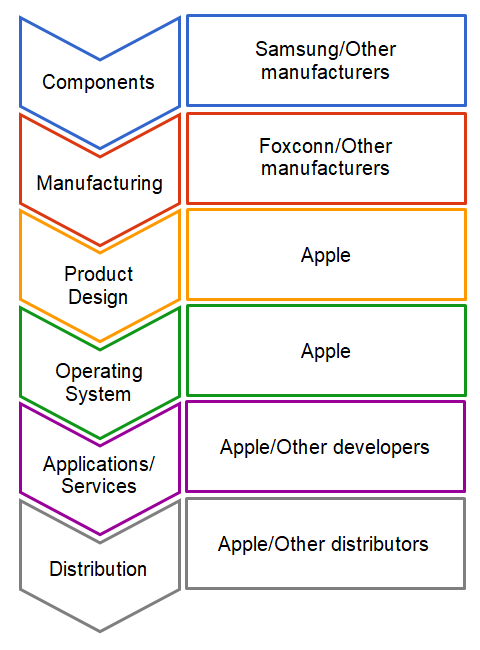
The company engages in many activities along the smartphone industry’s value chain, including:
- Product Design;
- Operating System;
- Applications/Services;
- Distribution.
The company also designs a lot of its own components, but outsources their manufacturing to other companies.
Why did the company choose to vertically integrate instead of relying on other software, application or distribution providers like most of its competitors do?
- Control. By designing its own hardware and unique software, the company can control how its devices look, how they’ll behave, when they’ll be released or have their software upgraded.
- Costs. By developing its own software, Apple does not have to pay licensing fees. In addition, by using its own direct distribution channel, the company can lower its distribution costs.
- User experience. Ultimately, all of Apple’s efforts to vertically integrate result in the best possible user experience the company can deliver to its customers. By integrating its hardware with software, developing applications, offering many additional services and by providing the best customer buying experience in its stores, Apple is able to deliver the best possible user experience among all of its rivals.
Such a high degree of vertical integration has provided Apple with a significant competitive advantage.
5. Efficient research and development (R&D) spending
Companies engage in R&D so they can introduce innovative products and services that satisfy ongoing consumer needs for newer and better offerings. The end goal of R&D spending is to create a competitive advantage and grow the company’s revenue.
Many technology companies spend lots of money on R&D to grow their sales, but few do so as successfully as Apple.
In 2019, Apple spent only 6.2% of its revenue on R&D or in absolute numbers US$16.217 billion, which was comparatively lower than Alphabet Inc.’s US$21.419 billion, Samsung Electronics’ US$16.952 billion or Microsoft Corporation’s US$16.876 billion. Even with the lowest R&D budget, Apple was still able to generate more revenue than any of its rivals.
Figure 5. R&D spending by Apple and its largest competitors in 2019 (in US$ billions and percentages)
| Company | R&D spending | Revenue | As a % of revenues |
|---|---|---|---|
| Apple Inc. | 16.217 | 260.174 | 6.2 |
| Samsung Electronics | 16.952 | 221.568 | 7.7 |
| Alphabet Inc. | 21.419 | 136.819 | 15.7 |
| Microsoft Corporation | 16.876 | 125.843 | 13.4 |
Apple’s low R&D spending shows how effectively its R&D budget is managed. The company is still considered as one of the most innovative world’s businesses and it is the largest world’s technology company, even though its R&D spending is lower than its major rivals’ budgets.
Weaknesses
1. Over-reliance on iPhone sales as a major revenue source
Apple’s major weakness is its reliance on one product to generate the majority of its revenue. The company receives US$142.381 billion or 54.7% of its total revenue from iPhone sales alone.
Figure 6. Apple revenue breakdown by product 2019 (% share of total revenue)
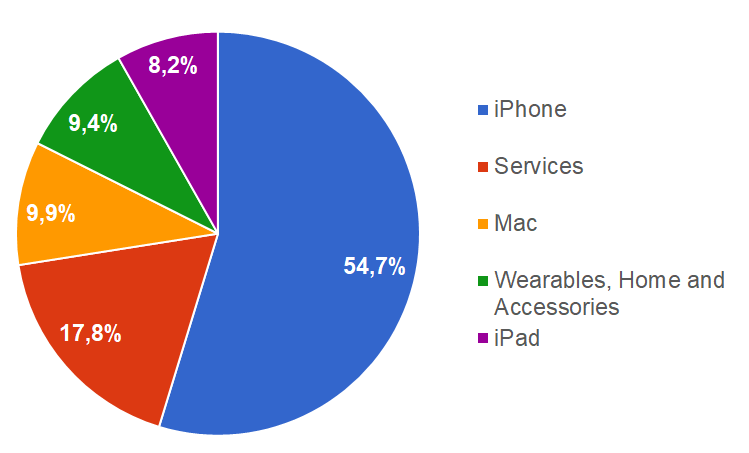
Why is this such a major weakness for the company? Most businesses try to diversify their revenue sources for a few reasons. There are many external forces that can negatively affect product sales and companies have no control over those external forces. For example, consumer tastes may change or there could be a component shortage for a specific product. Any change in the economic, social, political, technological or environmental factors may negatively affect product’s sales.
Since 2014, Apple’s dependence on iPhone sales grew from 55.8% to 61.6% in 2017 and again declined to 54.7% in 2019. While the company is trying to diversify its revenue sources, it is still largely affected by iPhone sales. The company’s revenue declined by 2% or US$5.6 billion in 2019, mainly due to the 13.6% or US$22.507 billion decline in iPhone sales.
Few of its rivals are as dependent on the sales of one product as Apple.
2. Declining market share in the largest smartphone market (China)
China is the largest smartphone market in the world with over 396 million units sold in 2018.[16] It is also the second largest premium smartphone market, which is the Apple’s main target market for its products and services.
Apple has been successfully competing in China since entering the market in 2009. It became the company’s second largest market in 2011 and is the only country besides the U.S. that generates over 10% of its revenue.
Figure 7. Apple revenue growth in China 2012-2019 (revenue in US$ billions, share in percentages)
| / | 2012 | 2013 | 2014 | 2015 | 2016 | 2017 | 2018 | 2019 |
|---|---|---|---|---|---|---|---|---|
| Revenue from China | 22.533 | 25.417 | 31.853 | 58.715 | 48.492 | 44.764 | 51.942 | 43.678 |
| % of total Apple revenue | 14.4% | 14.9% | 17.4% | 25.1% | 22.5% | 19.5% | 19.6% | 16.8% |
Figure 8. Apple’s revenue growth in China 2012-2019
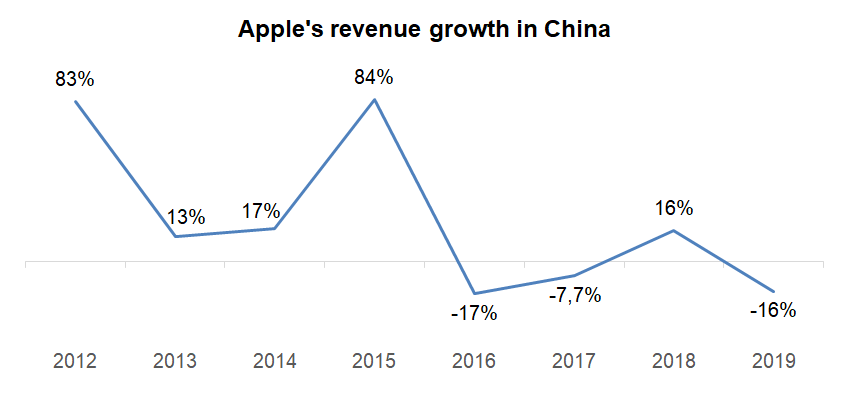
Initially, Apple grew in China because its products conveyed status that no other brand could offer. The company was also the only one which could provide the best quality products with a great ecosystem.
Despite those competitive advantages, Apple’s products and services are seen as luxury items that only rich people in China can afford. As the market matured and competition intensified, Apple started to lose its market share. That’s because Chinese rivals Huawei, Vivo, OPPO, Lenovo and Xiaomi are capable of manufacturing high quality smartphones and tablets for much lower prices than Apple. Consumers’ tastes in China also changed. Many Chinese now consider their own local brands as quality products. [15]
These and many other factors resulted in Apple’s revenue dropping by US$8.264 billion or 16% in China in 2019. The company should change its strategy in China or the company’s market share in it will continue to decline.
3. Few successful innovations introduced over the past few years
Apple has been considered one of the most innovative technology companies in the world. It has introduced many breakthrough products to the market, such as the iPod, iPhone and iPad. Apple’s focus on innovation has helped the company to become the largest technology company in the world.
Nonetheless, the company’s innovation has slowed down and the company hasn’t introduced any disruptive products or services since the iPad. In the Fast Company’s list of “The Most Innovative Companies of 2019”.[20] Since 2012, the company has been awarded the most innovative company title only once.[21] Forbes, which has its own list of the 50 most innovative companies in the world, doesn’t even list Apple in it.[22]
While Apple is still capable of growing its revenue without the breakthrough products and services it traditionally introduced to the market, it will have difficulties maintaining its growth in the future when hardware products will become more commoditized.
Opportunities
1. Augmented and virtual reality markets will be worth US$104 billion by 2023
As tablet sales decline and smartphone markets are becoming more and more saturated, technology companies like Apple and Samsung have to look for other growth opportunities. These opportunities could come from the augmented reality (AR) and virtual reality (VR) markets.
According to IDC, the combined AR and VR markets are expected to be worth US$10.5 billion in 2019.[23] Both markets are in their infancy and their real growth is expected in the near future. IDC’s research expects the markets to be worth US$18.8 billion in 2020 and to grow by 77% annually during a five-year period. If these predictions are correct, AR and VR markets should be worth around US$104 billion in 2023.[23]
A research done by Research and Markets[20], indicates that AR market could be worth US$60.55 billion by 2023, growing on average by 40.29% every year. The VR market is expected to be smaller, worth US$34.08 billion by 2023, growing on average by 33.95% every year. Both markets are expected to be worth around US$100 billion combined by 2023.[24]
Why should Apple venture into either of these markets? First, according to Tim Merel from TechCrunch[25], the AR market needs to overcome 5 obstacles to become a mass market:
- A flagship device that is capable of supporting AR;
- An all-day lasting battery;
- Mobile connectivity;
- An app ecosystem;
- Telco cross-subsidization.
With an introduction of an iPhone 11 and the company’s recent acquisitions of PrimeSense, Metaio and RealFace companies, who all work on various 3D technologies and face recognition, the company is now capable to overcome all 5 obstacles. Many reports suggest that Apple will launch its first AR headset in 2022 and a pair of AR glasses in 2023.[26]
How about the virtual reality market? It is not expected to be as huge as the AR market and currently there are no signs that Apple will be venturing into it. Nonetheless, the VR market is going to be worth over US$30 billion in the future and Apple shouldn’t miss this opportunity.
AR and VR will become very profitable growth markets and Apple should take advantage of this opportunity before its rivals could establish themselves in these markets.
2. Increasing demand for voice-controlled virtual assistants in home devices
Apple was the first company to launch its own voice-activated virtual assistant (called Siri) back in 2011. This gave Apple’s devices a competitive advantage over those of their rivals. However, their competitors soon caught up and now Google offers Assistant, Amazon has Alexa and Microsoft offers Cortana as virtual assistants (VA).
Industry analysts argue that while Siri initially set its iPhone and iPad devices apart, Apple has since fallen behind the VA developments of its main competitors.[27] The company only recently added a Siri developer kit, which allows third party developers to create applications that connect with Siri. Siri is also only available on the Apple’s products such as the iPad, iPhone and Apple Watch.
While smartphones will remain the primary VA sources, the current trend is to let the VA into homes and third-party hardware. For example, Amazon has launched Amazon Echo, a speaker that listens to your voice and executes the commands. It allows you to control the connected apps and devices through your voice. Google has a similar devices, but with greater capabilities due to their Assistant’s connection to a wider range of devices. Google also allows its virtual assistant to be added to third party hardware. This allows Google to widen its VA product ecosystem. Hardware can be connected and controlled through only one VA and accessed almost anywhere in a house.
Research from Markets&Markets reveals that the market for intelligent virtual assistants will be worth over US$25.63 billion by 2025.[28] While it’s not the biggest market opportunity for Apple, the company could increase its efforts on Siri development. This would strengthen the company’s ecosystem and provide a better user experience.
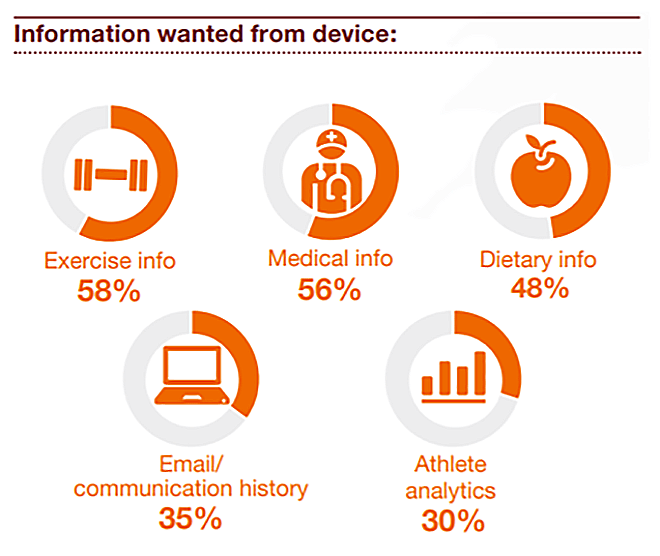
3. Wearable medical device market will be worth US$62.82 billion by 2025
Over 305.2 million wearable devices were sold in 2019 alone, representing 71.4% market growth over 2018.[29] IDC forecasts that the market for wearables will grow on average by 22.4% until 2023, reaching 489.1 million units. Out of all wearable devices, the most prominent will be earwear and smartwatches, accounting for about 55.9% and 22.3% of the market respectively.
One of the main factors contributing to this wearable market increase will be the demand for health-related wearables.[30] Wearables are getting more accurate at measuring heart rate, blood pressure, body temperature, stress levels and other health conditions. Various apps combined with wearable data can efficiently and effectively monitor and diagnose your health and help you share that data with your doctors. The market for wearable medical devices will see significant growth in the future. A report from Meticulous Research predicts that the global wearable medical devices market will reach US$62.82 billion by 2025.[31]
Apple is well positioned to take advantage of this opportunity. The company has already released successful Apple Watch devices. These could be further improved to monitor and store various health data. By capturing only 10%-20% market share the company could potentially earn US$6 billion to US$12 billion in additional revenue with an enhanced Apple Watch device.
Figure 9. UK respondents’ answer of what information they want from their wearable device
Threats
1. Smartphones and tablets are becoming a commodity, which could impact the company’s gross margins
Apple released its first iPhone in 2007, disrupting the mobile phone market and setting the standards for the new smartphone market. At the beginning, most smartphone manufacturers were competing with each other based on hardware, design, software and additional services.
Since then, smartphones have improved a lot. Apple is finding it very hard to differentiate its iPhones through incremental hardware improvements, as are other smartphone manufacturers. In order to increase their market share, most of the smaller smartphone vendors are actually offering the same or near the same quality hardware in their smartphones as Apple for much lower prices.[33]
Smartphone designs are also getting more similar. All the major smartphone brands offer phones in metal or glass with rounded corners, similar color choices and bezel-less screens.
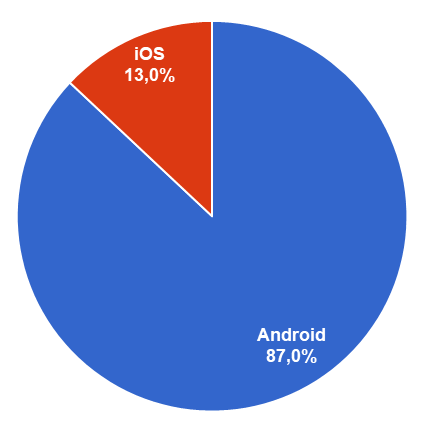
At the moment, software is the major differentiator between Apple’s iPhones and its rivals’ devices. iOS (Apple’s proprietary mobile operating system) is the only competitor to Google’s Android, which runs on nearly every other smartphone sold in the world. 2019, Android dominated the smartphone market with 87% market share compared to iOS’s 13% market share.[34] Android also closes the quality and user experience gap between it and iOS through constant improvement. If Android will become as good as iOS in delivering a great customer experience, iPhone’s unique selling proposition will disappear.
Figure 11. Smartphone OS market share 2019
However, Apple still has an option to differentiate its tablets and smartphones with additional services through its ecosystem. The company’s brand reputation and customer loyalty also play a significant role in consumer decisions to purchase tits products and services.
In 2019, Apple is still the major premium smartphone and tablet company, with very high average selling prices for its products. Nonetheless, its gross margins are declining and will continue to decline. Its average selling prices will not grow as fast as the manufacturing and marketing costs needed to differentiate its iPhones and iPads from the competition.
2. Growing number of attacks on the company’s information technology systems
According to the Identity Theft Resource Center, instances of personal information theft are growing. In 2018, 1,244 identity thefts were reported.[35] Over the last 10 years, billions of records of personal information have been stolen, with significant associated damages incurred by both affected businesses and their customers.
In 2018 alone, Apple sold 217.72 million iPhone devices[36] which could potentially be targeted through various software exploits and bugs. The company also sold millions of iPads, Mac computers and other wearable devices. For all purchases of its iOS devices, the company collects and stores various data about users including their email addresses, passwords and credit/debit card information. Apple, therefore has hundreds of millions of user records that could be stolen.
Due to the Apple brand’s popularity and its growing user base the company is becoming one of the main targets for attack by personal information thieves.
Apple recognizes this threat and describes it in its financial report:
“The Company’s business requires it to use and store confidential information including, among other things, personally identifiable information (“PII”) with respect to the Company’s customers and employees. The Company devotes significant resources to network and data security, including through the use of encryption and other security measures intended to protect its systems and data. But these measures cannot provide absolute security, and losses or unauthorized access to or releases of confidential information occur and could materially adversely affect the Company’s reputation, financial condition and operating results.” [1]
Every year Apple becomes one of the most important targets for identity theft. This has the potential to threaten the company’s reputation and incur losses for the company and its customers.
3. New patent infringements resulting in negative publicity affecting the company’s reputation
Apple is operating in the technology industry where competition is often based on patents. Patents, especially software and design patents, are often vague and technology companies often breach them. The consequences are rarely favorable and infringing companies need to pay royalties or damages if they lose legal cases. Over the past 10 years, Apple has infringed many patents and has had to pay damages accordingly.
The company identifies this as one of the main threats:
“The Company is subject to various legal proceedings and claims that have arisen in the ordinary course of business and have not yet been fully resolved, and new claims may arise in the future. In addition, agreements entered into by the Company sometimes include indemnification provisions which can subject the Company to costs and damages in the event of a claim against an indemnified third party.
Claims against the Company based on allegations of patent infringement or other violations of intellectual property rights have generally increased over time and may continue to increase. In particular, the Company has historically faced a significant number of patent claims relating to its cellular-enabled products, and new claims may arise in the future.
For example, technology and other patent-holding companies frequently assert their patents and seek royalties and often enter into litigation based on allegations of patent infringement or other violations of intellectual property rights. The Company is vigorously defending infringement actions in courts in several U.S. jurisdictions, as well as internationally in various countries. The plaintiffs in these actions frequently seek injunctions and substantial damages.”[1]
There’s no guarantee that Apple, willingly or not, will not breach more patents in the future, resulting in damages that have to be paid and the associated negative publicity that would hurt the company’s reputation.
4. The rising U.S. dollar exchange rate could negatively affect the company’s revenue and profits
Currency exchange rates affect every multinational company, including Apple. In 2019, the company earned US$157.908 billion or 60.7% of its revenue outside of the U.S.[1]
Figure 10. Apple’s revenue geographic breakdown
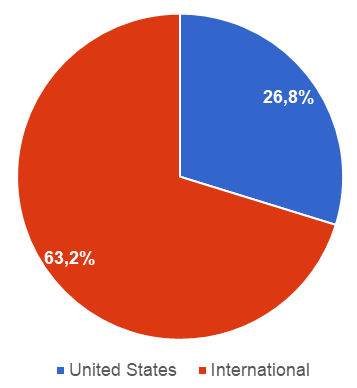
This means that Apple currently receives a large share of its profits in currencies other than the U.S. dollar. Other currencies therefore have to be converted to the U.S. dollar in order for the company to be able to calculate its total revenue and transfer its profits back to the U.S. This is where a strong U.S. dollar, or in other words, the currently rising U.S. dollar exchange rate damages company’s financial position. In its financial report, Apple mentioned multiple times that its sales were unfavorably impacted by the weakness in foreign currencies compared to U.S. dollar.
A strong dollar does not only decrease the profits from foreign countries but also makes the company’s products more expensive and less attractive to the customers abroad.
In 2019, the U.S. dollar increased in value against other currencies for the second consecutive year. Current forecasts indicate that the U.S. dollar exchange rate may continue to increase against other currencies in 2020 as well.[37] This means that Apple products will become even pricier abroad and its revenue and profits from outside the country are likely to decrease when converted to U.S. dollars.
Summary
Apple Inc. has become the most valuable company in the world worth US$ 2,6 trillion in 2023. The company’s success is revealed in this SWOT’s 5 most important strengths.
Apple should continue to focus on developing its unique software and hardware ecosystem, which is the main company’s differentiator and the main competitive advantage over the rivals. In addition, Apple should improve and strengthen its R&D capabilities and introduce more innovative products to the market.
As for the weaknesses, the decline in China should be addressed as soon as possible. China’s market isn’t the most lucrative in terms of profit, but it is the largest and the market share in Chinese smartphone market is vitally important for the future success.
Improved smartphone and wearable technologies have given rise to many opportunities for Apple. The company is well aware of the opportunities that augmented and virtual reality markets have to offer. This is currently the most important and profitable opportunity Apple should pursue.
Few threats are posing real danger for the company. Smartphone commoditization will put pressure on margins, but there are some ways Apple could differentiate its phones from rivals’ offerings and keep the current margins.
Over the next few years, Apple will continue to grow successfully.
Sources
- Apple, Inc. (2019). Form 10-K for the Fiscal Year Ended September 30, 2019. Available at: https://s2.q4cdn.com/470004039/files/doc_financials/2019/ar/_10-K-2019-(As-Filed).pdf Accessed January 7, 2020
- Apple, Inc. (2020). Retail Stores. Available at: https://www.apple.com/retail/storelist/ Accessed January 7, 2020
- Fortune (2019). Fortune Global 500. Available at: https://fortune.com/global500/2019/ Accessed January 7, 2020
- Interbrand (2019). Best Global Brands 2019. Available at: https://www.interbrand.com/best-brands/best-global-brands/2019/ranking/ Accessed January 7, 2020
- Forbes (2020). The World’s Most Valuable Brands. Available at: https://www.forbes.com/powerful-brands/list/ Accessed January 7, 2020
- Graham, M. at CNBC (2019). Apple’s ad agency has layoffs as the company beefs up its in-house ads group. Available at: https://www.cnbc.com/2019/11/05/apples-advertising-agency-media-arts-lab-lays-off-several-employees.html Accessed January 7, 2020
- BankMyCell (2019). Smartphone Brand Loyalty Statistics (2019). Available at: https://www.bankmycell.com/blog/smartphone-brand-loyalty-during-trade-in-2019/ Accessed January 7, 2020
- Brand Keys (2019). 2019 Winning Brands – Brand Keys Customer Loyalty Engagement Index. Available at: https://brandkeys.com/wp-content/uploads/2019/05/2019-CLEI-Category-Winners.pdf Accessed January 7, 2020
- Brand Keys (2014). 2014 Winning Brands – Brand Keys Customer Loyalty Engagement Index. Available at: https://brandkeys.com/wp-content/uploads/2014/12/2014-Brand-Keys-Loyalty-Leaders-List-PR-Finalv3.pdf Accessed January 7, 2020
- Brand Keys (2015). 2015 Winning Brands – Brand Keys Customer Loyalty Engagement Index. Available at: https://brandkeys.com/wp-content/uploads/2015/02/Brand-Keys-CLEI-2015.pdf Accessed January 7, 2020
- Brand Keys (2016). 2016 Winning Brands – Brand Keys Customer Loyalty Engagement Index. Available at: https://brandkeys.com/wp-content/uploads/2016/10/2016-Loyalty-Leaders-Top-100-List.pdf Accessed January 7, 2020
- Brand Keys (2017). 2017 Winning Brands – Brand Keys Customer Loyalty Engagement Index. Available at: https://brandkeys.com/wp-content/uploads/2017/09/2017-CLEI-table-of-category-winnersFINALfeb1.pdf Accessed January 7, 2020
- Samsung Electronics Co., Ltd.(2019). Consolidated Statements of Financial Position. Available at: https://images.samsung.com/is/content/samsung/p5/global/ir/docs/2018_con_quarter04_all.pdf Accessed January 7, 2020
- Alphabet Inc. (2019). Form 10-K for the Fiscal Year Ended December 31, 2018. Available at: https://abc.xyz/investor/static/pdf/20180204_alphabet_10K.pdf Accessed January 7, 2020
- Microsoft Corporation (2019). Form 10-K for the Fiscal Year Ended June 30, 2019. Available at: https://microsoft.gcs-web.com/static-files/7c96b326-33bc-4b84-8abb-7afd7a517ea3 Accessed January 7, 2020
- Canalys (2019). China’s smartphone market falls 14% in 2018, with just under 400 million units shipped. Available at: https://www.canalys.com/newsroom/china%E2%80%99s-smartphone-market-falls-14-in-2018-with-just-under-400-million-units-shipped Accessed January 7, 2020
- Apple, Inc. (2012). Form 10-K for the Fiscal Year Ended September 29, 2012. Available at: http://files.shareholder.com/downloads/AAPL/3883149972x0xS1193125-12-444068/320193/filing.pdf Accessed January 7, 2020
- Apple, Inc. (2014). Form 10-K for the Fiscal Year Ended September 27, 2014. Available at: http://files.shareholder.com/downloads/AAPL/3883149972x0x789040/ED3853DA-2E3F-448D-ADB4-34816C375F5D/2014_Form_10_K_As_Filed.PDF Accessed January 7, 2020
- Wang, Y (2017). Why iPhone X Isn’t The Answer To Apple’s China Problem. Available at: https://www.forbes.com/sites/ywang/2017/09/12/why-iphone-x-isnt-the-answer-to-apples-china-problem/ Accessed January 7, 2020
- Fast Company (2019). The World’s 50 Most Innovative Companies 2019. Available at: https://www.fastcompany.com/most-innovative-companies/2019 Accessed January 7, 2020
- Fast Company (2018). The World’s 50 Most Innovative Companies 2018.Available at: https://www.fastcompany.com/most-innovative-companies/2018 Accessed January 7, 2020
- Forbes (2020). The World’s Most Innovative Companies. Available at: https://www.forbes.com/innovative-companies/ Accessed January 7, 2020
- IDC (2019). Worldwide Spending on Augmented and Virtual Reality Expected to Reach $18.8 Billion in 2020. Available at: https://www.idc.com/getdoc.jsp?containerId=prUS45679219 Accessed January 7, 2020
- Research and Markets (2018). Augmented Reality and Virtual Reality Market by Offering, Device Type, Application, and Geography – Global Forecast to 2023. Available at: https://www.researchandmarkets.com/research/dm5djr/augmented_reality?w=4 Accessed January 7, 2020
- Merel, T. (2017). The reality of VR/AR growth. Available at: https://techcrunch.com/2017/01/11/the-reality-of-vrar-growth/ Accessed January 7, 2020
- Johnson, L. at Macworld (2019). Apple AR headset rumors: Apple may release headset in 2022, glasses by 2023. Available at: https://www.macworld.com/article/3446839/apple-ar-glasses-rumors.html Accessed January 7, 2020
- Wollerton, M. at Cnet (2019). Alexa, Google Assistant and Siri will get smarter this year. Here’s how. Available at: https://www.cnet.com/news/alexa-vs-google-assistant-vs-siri-the-state-of-voice-after-google-io-and-wwdc-2019/ Accessed January 7, 2020
- Grand View Research (2019). Intelligent Virtual Assistant (IVA) Market Size, Share & Trends Analysis Report. Available at: https://www.businesswire.com/news/home/20190822005478/en/Global-Intelligent-Virtual-Assistant-IVA-Market-2019-2025 Accessed January 7, 2020
- Business Wire (2019). Worldwide Wearables Market to Top 300 Million Units in 2019 and Nearly 500 Million Units in 2023, Says IDC. Available at: https://www.businesswire.com/news/home/20191216005029/en/Worldwide-Wearables-Market-Top-300-Million-Units Accessed January 7, 2020
- IDC (2019). Wrist-Worn Wearables Maintain a Strong Growth Trajectory in Q2 2019, According to IDC. Available at: https://www.idc.com/getdoc.jsp?containerId=prUS45521319 Accessed January 7, 2020
- Globe News Wire (2019). Wearable Devices Market worth $62.82 billion by 2025- Exclusive Report by Meticulous Research. Available at: https://www.globenewswire.com/news-release/2019/10/31/1938647/0/en/Wearable-Devices-Market-worth-62-82-billion-by-2025-Exclusive-Report-by-Meticulous-Research.html Accessed January 7, 2020
- PwC (2016). The Wearable Life 2.0. Available at: https://www.pwc.com/us/en/industry/entertainment-media/assets/pwc-cis-wearables.pdf Accessed January 7, 2020
- Product Chart (2020). Smartphones. Available at: https://www.productchart.com/smartphones/ Accessed January 7, 2020
- 34. IDC (2019). Smartphone Market Share. Available at: https://www.idc.com/promo/smartphone-market-share/os Accessed January 7, 2020
- Identity Theft Resource Center (2019). 2018 Annual Data Breach Year-End Review. Available at: https://www.idtheftcenter.org/2018-data-breaches Accessed January 7, 2020
- Statista (2019). Global Apple iPhone sales from 3rd quarter 2007 to 4th quarter 2018 (in million units). Available at: https://www.statista.com/statistics/263401/global-apple-iphone-sales-since-3rd-quarter-2007/ Accessed January 7, 2020
- Christensen, N. at Kitco (2019). U.S. Dollar can still roar in 2020 even as it ends 2019 with a whimper. Available at: https://www.kitco.com/news/2019-12-31/U-S-Dollar-can-still-roar-in-2020-even-as-it-ends-2019-with-a-whimper.html Accessed January 7, 2020