The movement of an organization from its present position to a desirable but uncertain future position is called strategy. It describes how the organization intends to create value for its shareholders, customers, and citizens.
But because the organization has never been to this future place, the pathway to it consists of a series of linked hypotheses.
When attempting to implement their business strategies, many top executives give their employees only limited descriptions of what they should do and why those tasks are important.
However, without clear and detailed information, companies are likely to see limited success in their strategy execution.
After all, how can people carry out a plan that they don’t fully understand?
What is a Strategy Map
This is where the Strategy Map comes into the picture. A strategy map is a tool for communicating both the strategy and the processes and systems that help implement that strategy.
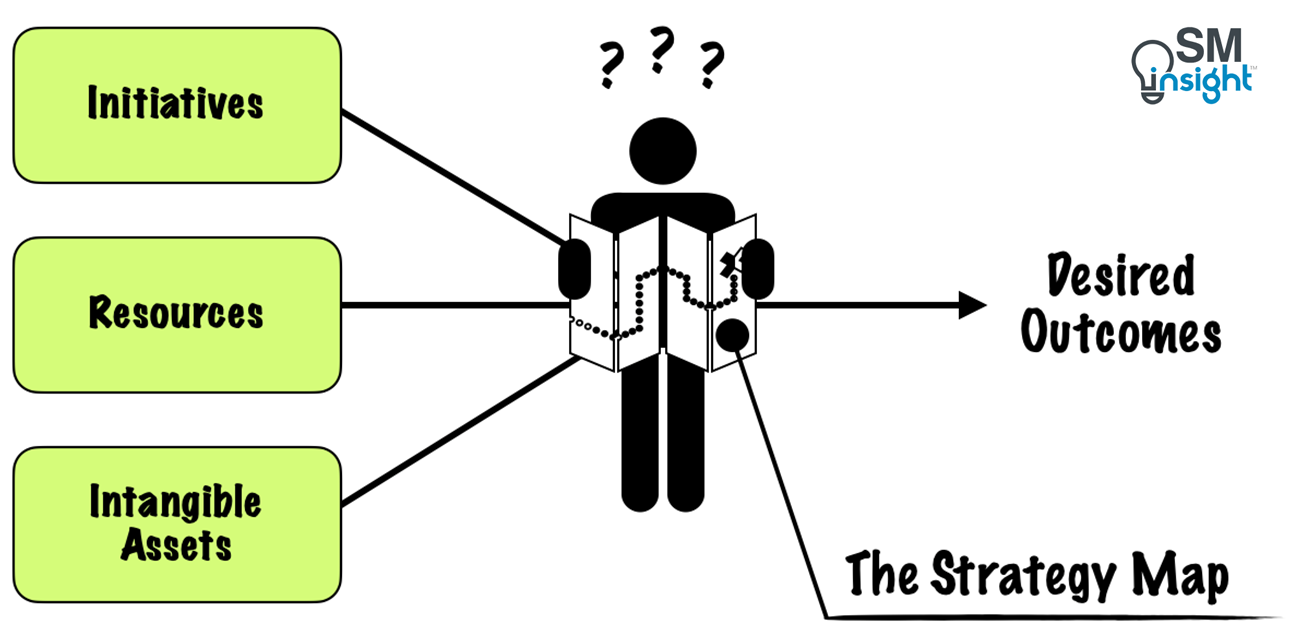
They give employees a clear line of sight into how their jobs are linked to the overall organizational objectives, enabling them to work in a coordinated, collaborative fashion toward the company’s desired goals.
They provide a visual representation of a company’s critical objectives and the crucial relationships among them that drive organizational performance.
The early strategy map diagrams were first discussed in a paper published by Robert S. Kaplan and David P. Norton in 1996 on the Balanced Scorecard Framework.[1] Their book – “The Balanced Scorecard, Translating Strategy into Action” published in the same year contained diagrams that later came to be known as strategy maps.[2]
Subsequently, the authors published their second book – “The Strategy Focused Organization”[3] which explicitly referred to strategy maps and includes a chapter on how to build them. Their third book – “Strategy Maps”[4] went further to describe how to visualize the strategy using strategy maps.
The need for a strategy map
In the industrial age, companies created value by transforming raw materials into finished products. A company’s competitive edge was largely based on tangible assets such as inventory, land, factories, and equipment. In that age, a business strategy could be described using financial tools such as general ledgers, income statements, and balance sheets.
In today’s information age, however, this is no longer sufficient.
The factors that decide competitive advantage have, today, shifted to intangible assets such as customer relationships, employee skills and knowledge, information technologies, and a corporate culture that encourages innovation and problem-solving.
However, the value of such intangible assets is decided by a company’s strategy.
For example, the success of a growth-oriented sales strategy will depend on the right mix of customer relationships, sales training, information systems, success-linked incentives, and a well-aligned organizational structure.
But creating value from intangible assets differs in several important when compared to tangible assets:
- Value creation is indirect: Assets such as knowledge and technology seldom have a direct impact on financial outcomes. They affect financial outcomes through chains of cause-and-effect relationships.
- Value is contextual: For example, training employees in TQM and Six Sigma techniques have greater value for organizations following a low total cost strategy than for one following a product leadership and innovation strategy.
- Value is potential: Assets, such as employee skills, don’t readily show their true value. Only when used through effective internal processes do they generate results for customers and improve finances. Otherwise, this potential remains dormant.
- Assets are bundled: Intangible assets seldom create value by themselves when isolated from organizational context and strategy. They unlock value only when they are aligned with the organization’s other intangible assets, with the organization’s tangible assets, and with the strategy.
Thus, to understand how organizations create value in the information age, Kaplan and Norton developed a tool known as The Balanced Scorecard (BSC) which measures a company’s performance from four major perspectives: financial, customer, internal process, and learning and growth.
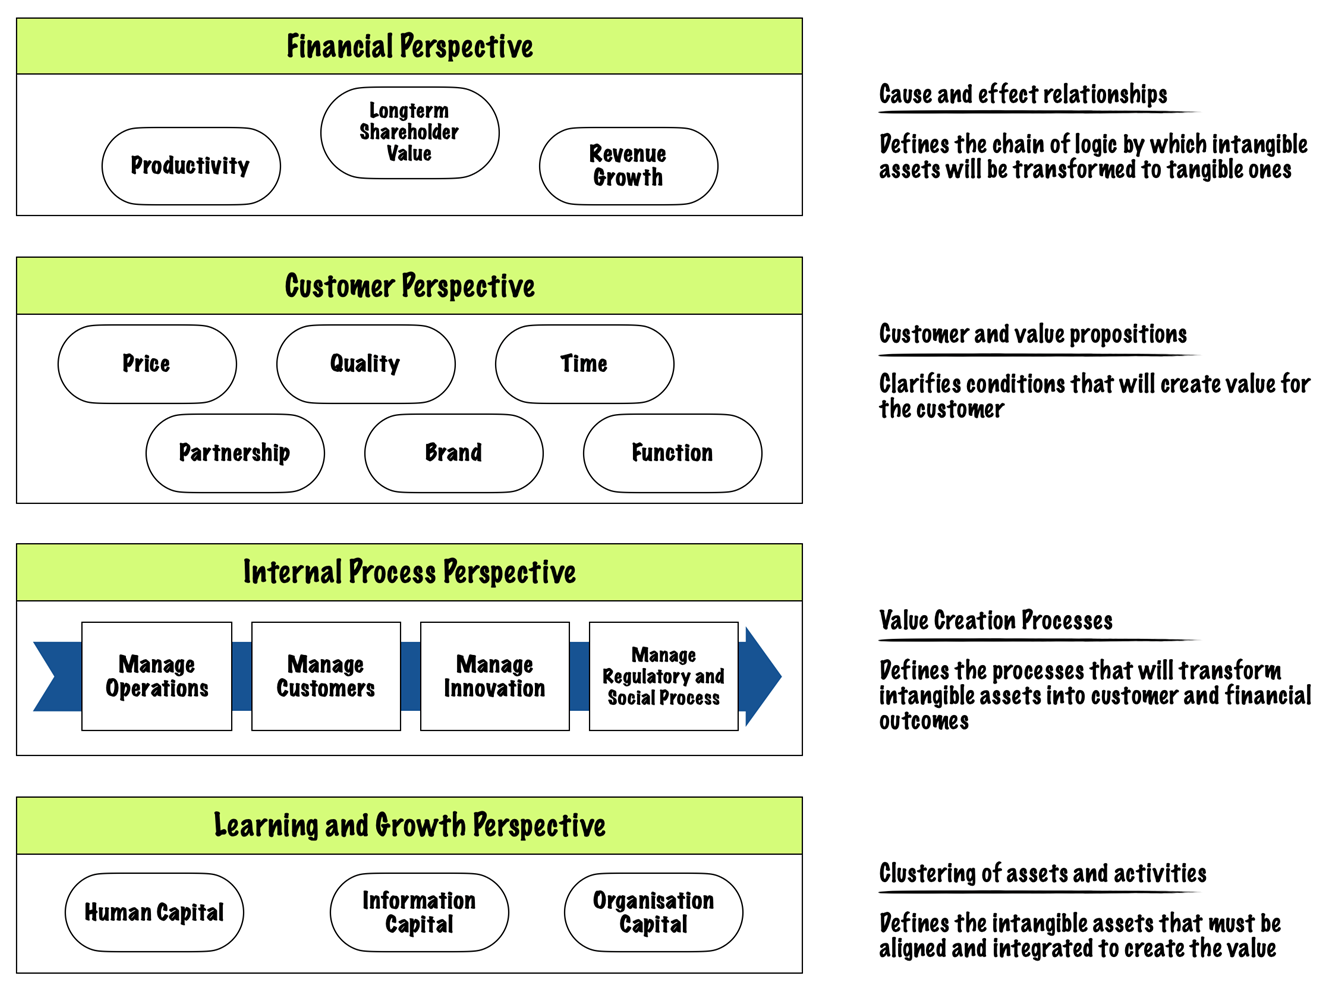
In brief, BSC tells a company what knowledge, skills, and systems its employees will need (their learning and growth) to innovate and build the right strategic capabilities and efficiencies (the internal processes) that deliver specific value to the market (the customers), which will eventually lead to higher shareholder value (the financials).
Having developed the BSC, Kaplan and Norton worked extensively with hundreds of executives across organizations. With extensive research, they noticed common patterns that prompted them to develop the strategy map.
The Strategy Map (or the Balanced Scorecard Strategy Map) is thus a common visual framework that embeds the different items on an organization’s balanced scorecard into a cause-and-effect chain, connecting desired outcomes with the drivers of those results.
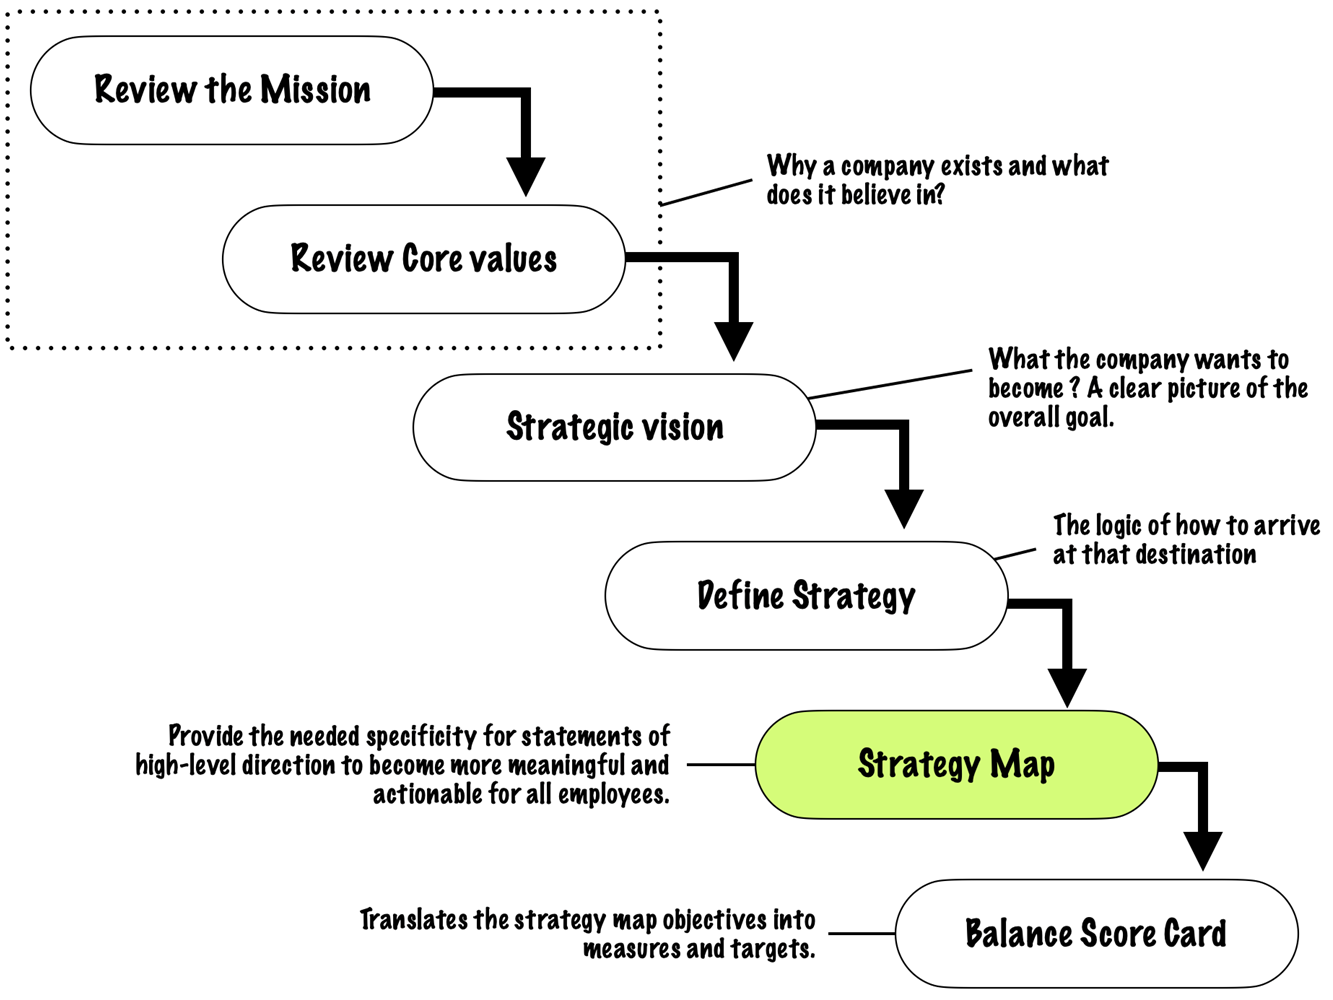
The strategy map describes the logic of the strategy, clearly showing the objectives for the critical internal processes that create value and the intangible assets required to support them. The Balanced Scorecard translates the strategy map objectives into measures and targets.
Prerequisites to Strategy Maps
Building a strategy map is not a stand-alone management process. It is one of the many steps in a logical continuum that moves an organization from a high-level mission statement to the work performed by frontline and back-office employees:
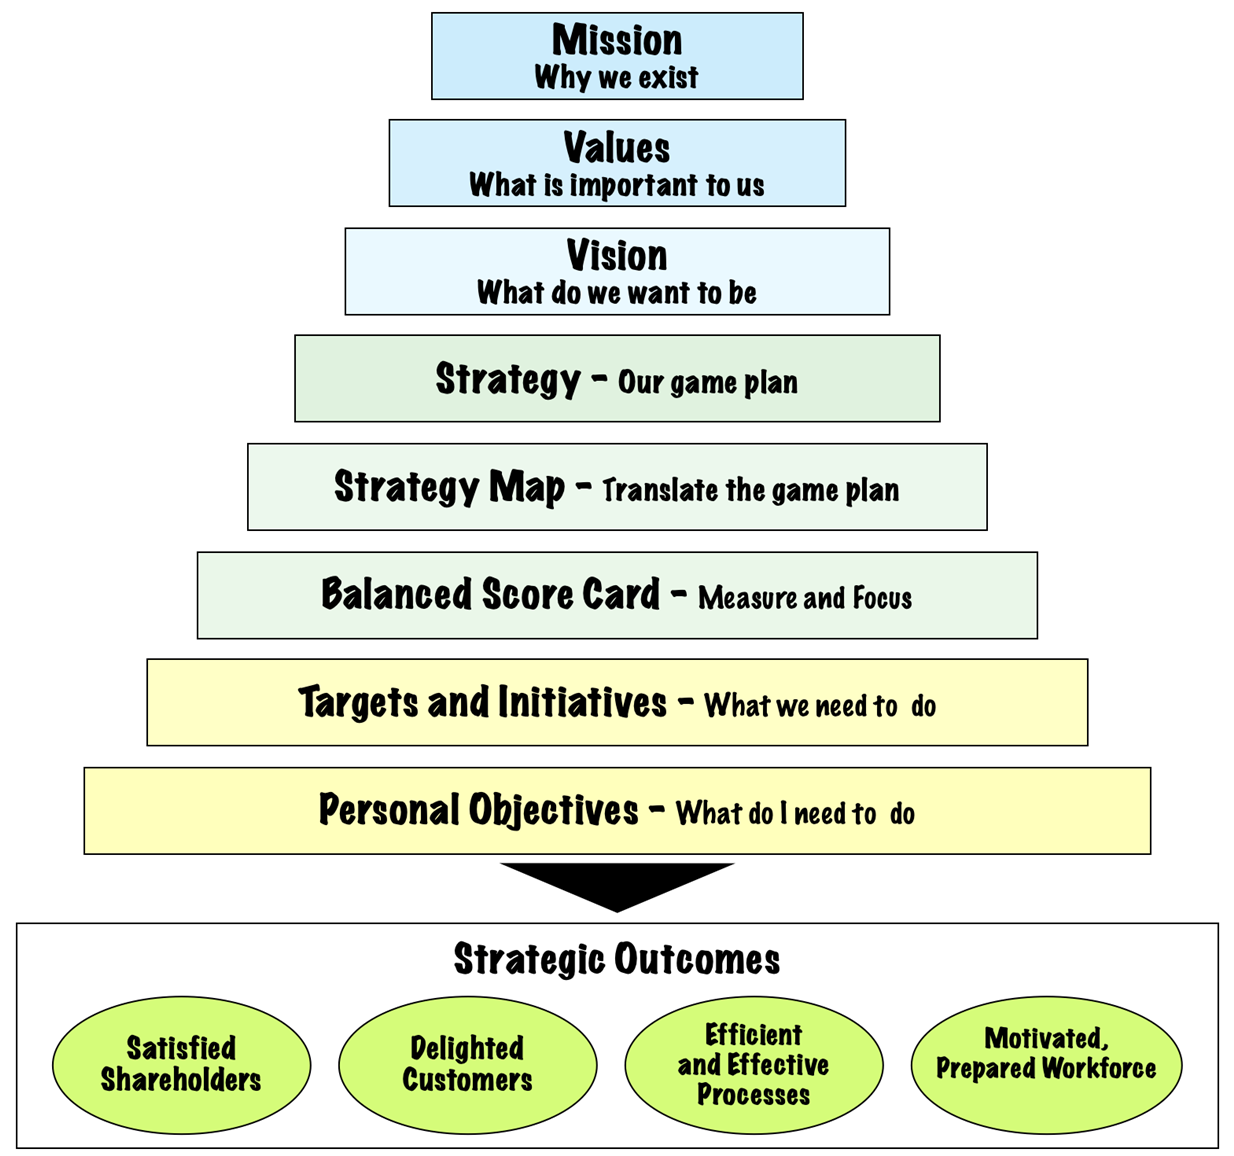
Mission is a concise, internally focused statement of the reason for the organization’s existence, the basic purpose toward which its activities are directed, and the values that guide employees’ activities. A mission describes how the organization expects to compete and deliver value to customers.
Vision follows the mission and is a concise statement that defines the mid to long-term (three to ten-year) goals of the organization. A Vision is external and market-oriented and expresses how the organization wants to be perceived by the world.
An organization’s mission and vision, together, set the general goals and direction for the organization. They help shareholders, customers, and employees understand what the organization is about and what it intends to achieve.
But by themselves, mission and vision statements are far too vague to guide day-to-day actions. Hence, to define how the vision and mission will be achieved, a strategy is needed.
Strategy is about selecting the set of activities in which an organization will excel to create a sustainable difference in the marketplace. Differentiation arises from both the choice of activities and how they are performed.
Thus, the best way to build strategy maps is from the top down, starting with the destination and then charting the routes that lead there.
Building the Strategy Map
Financial perspective: balancing the contradictory forces – long-term vs. short-term
Building a strategy map typically starts with a financial strategy with a goal to increase shareholder value. Companies have two basic levers to achieve this: Revenue Growth and Productivity Improvements.
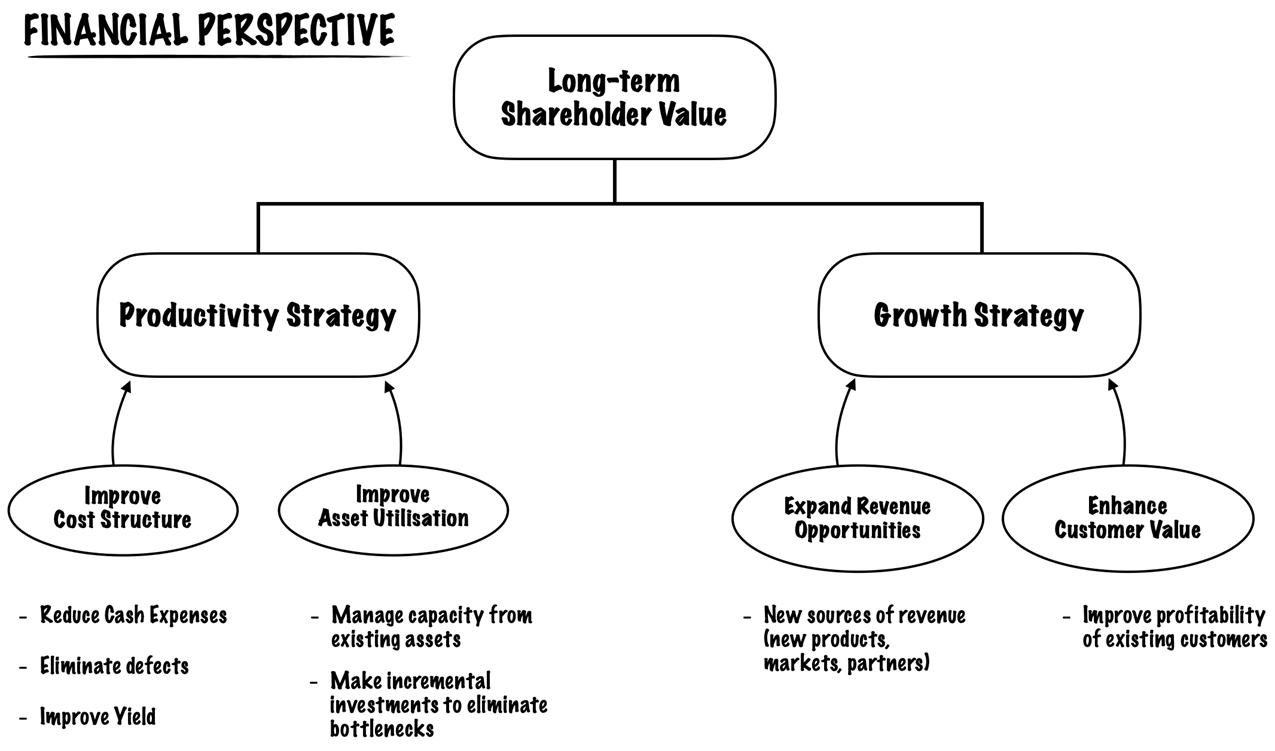
The link to strategy from the financial perspective arises as organizations choose a balance between the often-contradictory levers of growth and productivity.
Actions to improve revenue growth generally take longer to create value than actions to improve productivity. Often, the pressure to show financial results to shareholders tends to favor the short term over the long term.
However, one of the principal contributions of a strategy map is to highlight the opportunities for enhancing financial performance through revenue growth and not just by cost reduction and improved asset utilization.
Thus, developing the first layer of the strategy map forces the organization to deal with this tension. By balancing the two strategies, a strategy map helps ensure that cost and asset reductions do not compromise a company’s growth opportunities with customers.
Customer perspective: Basing strategy on a differentiated value proposition
The customer perspective of the strategy map defines the specific value propositions required to grow revenues and connects an organization’s internal processes to customer outcomes.
It details how the organization will differentiate itself from competitors to attract, retain, and deepen relationships with targeted customers.
Typically, the value proposition is chosen from among three differentiators:
- Operational excellence: excel at competitive pricing, product quality and selection, speedy order fulfillment, and on-time delivery.
- Customer intimacy: stress upon the quality of relationships with customers, including exceptional service and the completeness of the solutions offered.
- Product leadership: Focus on the functionality, features, and overall performance of products or services.
Shown below is a template that translates the three generic strategy concepts into the strategy map. They also serve as a diagnostic check as to whether a company’s balance scorecard measures match its strategy.
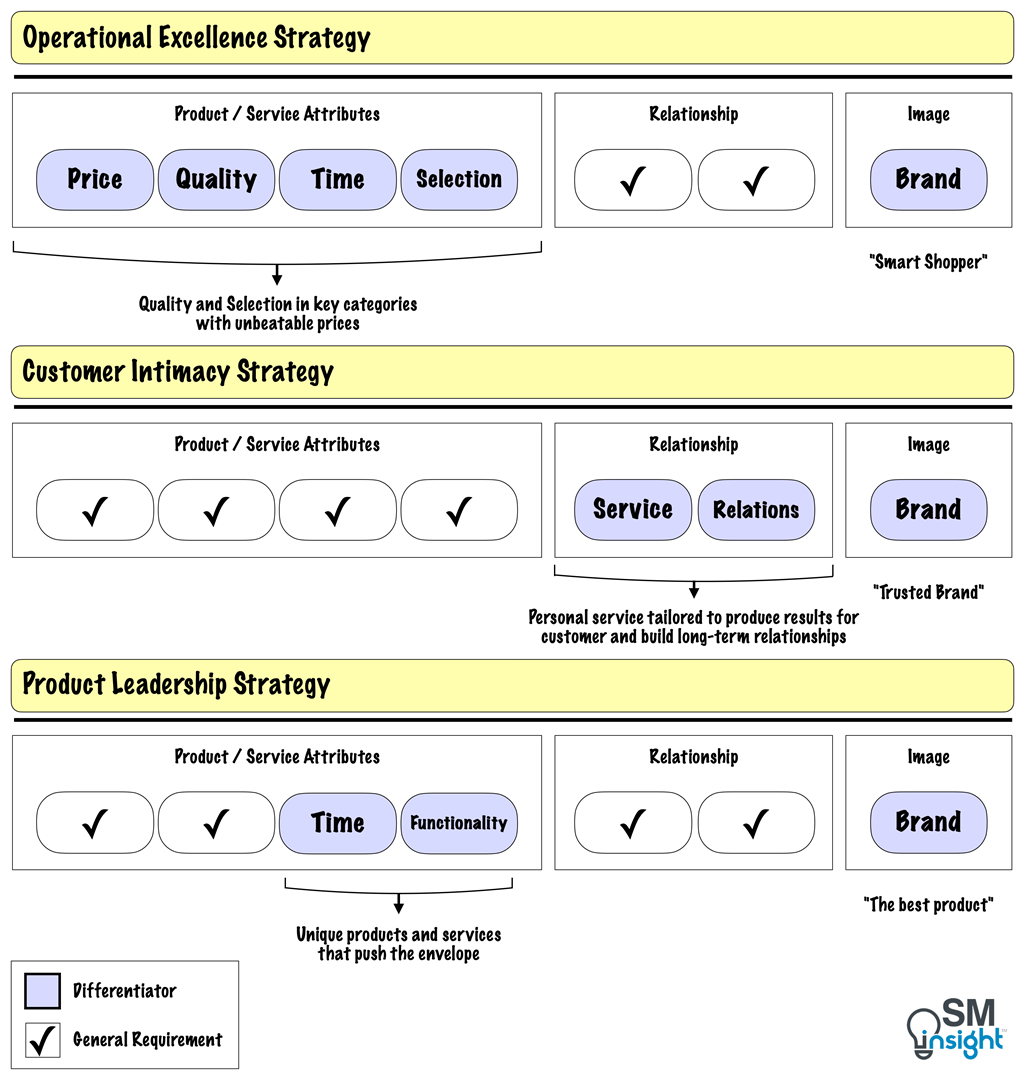
Different aspects of the value proposition become crucial depending on the chosen strategy.
Companies strive to excel in one of the three areas while maintaining threshold standards in the other two. By identifying its customer value proposition in a strategy map, a company will know which classes and types of customers to target.
For example, Retail giants like Walmart and Costco use the operational excellence strategy. By selling items at low prices, in bulk, and in a warehouse environment, they maintain cost leadership. Customers come to them for convenience and low cost and not for the uniqueness of products or sales support.
Banks like J. P. Morgan provide unique and elevated private banking experiences shaped around their customers’ needs by following the customer intimacy strategy.
On the other hand, auto brands like Mercedes follow a product leadership strategy where they focus on innovation, cutting-edge features, best-in-class performance, and comfort in their cars.
By selecting the customer value proposition in the strategy map, companies can detect if the balanced scorecard measures are in alignment with their strategy.
Since markets consist of heterogeneous customers, not all of whom value the same parameters, the strategy map also forces companies to choose their customers or customer segments.
Not only does it allow a company to select value propositions at which it will excel, but also the right customer segments in which its choice of value propositions become the differentiators.
Internal perspective: Creating value through internal business processes
Having defined the financial and customer perspective of its strategy map, an organization has a clear picture of its objectives for economic success and the targeted customers and value proposition.
The next step, then, is to determine the means by which it will achieve the differentiated value proposition for customers and the productivity improvements to reach its financial objectives.
The internal process perspective captures these critical organizational activities. They fall into four high-level processes:
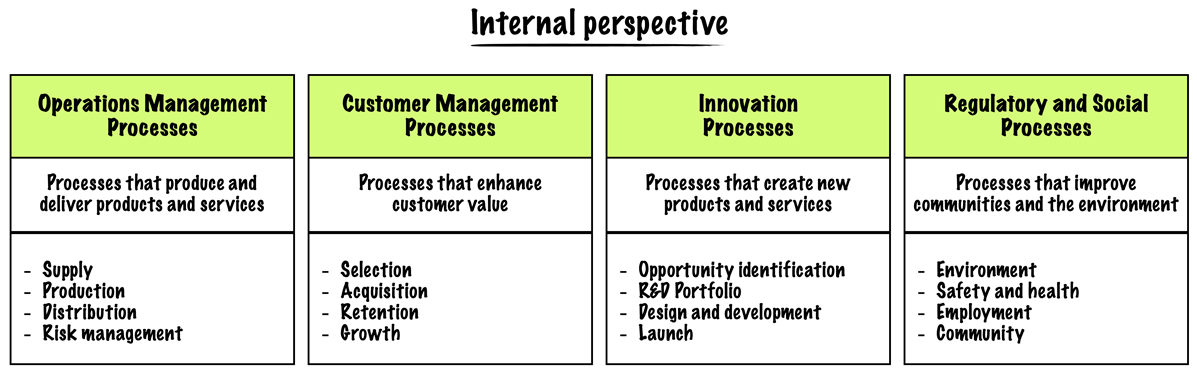
Operations management processes
These are the basic, day-to-day processes by which companies produce their existing products and services and deliver them to customers.
For example, for a manufacturing company, this includes processes such as acquiring raw materials, converting them into finished goods, distribution and managing risk. For a service company, this could be producing and delivering the services used by customers.
Customer management processes
These are processes that expand and deepen relationships with targeted customers. Broadly, there are four sets of customer management processes:
- Customer selection: involves identifying the target populations for which the company’s value proposition is most desirable.
This process defines a set of customer characteristics that describe an attractive customer segment for the company. For example, a consumer company may choose customers based on income, wealth, age, family size, lifestyle etc. - Customer acquisition: processes relating to generating leads, communicating to new potential customers, choosing entry-level products, pricing the products, and closing the sale.
- Customer retention: processes that result in excellent service and responsiveness to customer requests. Timely, knowledgeable service units are critical for maintaining customer loyalty and reducing the likelihood of customer defections.
- Growth: these are processes that help grow a customer’s business with the company such as managing the relationship effectively, cross-selling multiple products and services, and strengthening the brand as a trusted partner.
Innovation processes
These are processes that involve developing new products, processes, and services that enable a company to penetrate new markets and customer segments. They fall under four sets of processes:
- Identifying opportunities for new products and services – generate new ideas by extending the capabilities of existing products and services, applying new discoveries and technologies, and learning from the suggestions of customers.
- Managing the research and development portfolio – processes that deal with making critical decisions on R&D approach such as project funding, internal development, collaborative ventures, licensing from external organizations, or complete outsourcing.
- Design and development of new products and services – processes that manage the core of product development and bring concepts to market. A good design and development process culminates in a product that has the desired functionality, is attractive to the targeted market, and can be produced with consistent quality and at a satisfactory profit margin.
- Bringing new products and services to market – processes that deal with introducing a new product to the market such that it achieves targeted levels of sales and production at specified levels of product functionality, quality, and cost.
Regulatory and Social Processes
These are processes that help organizations continually earn the right to operate in the communities and countries in which they produce and sell.
Investing in the environment, health, safety, employment practices, and community development helps companies develop reputation and trust among employees and customers.
Companies must seek to go beyond complying with the minimal standards established by regulations. They must perform better than the regulatory constraints so that they develop a reputation as an employer of choice in every community in which they operate.
Working with complimentary themes simultaneously
The internal perspective of a strategy map consists of complementary themes that must work simultaneously.
A company following a product leadership strategy would stress excellence in innovation processes while that following a low total cost strategy would focus on operating processes. Likewise, a company following a customer solutions strategy would emphasize customer management processes.
But even with an emphasis on one of the four clusters of internal processes, companies must still follow a “balanced” strategy and invest in improving processes in all four clusters.
There are hundreds of processes taking place simultaneously in an organization, each creating value in some way. The art of strategy is to identify and excel at the critical few internal processes that are the most important to the customer value proposition.
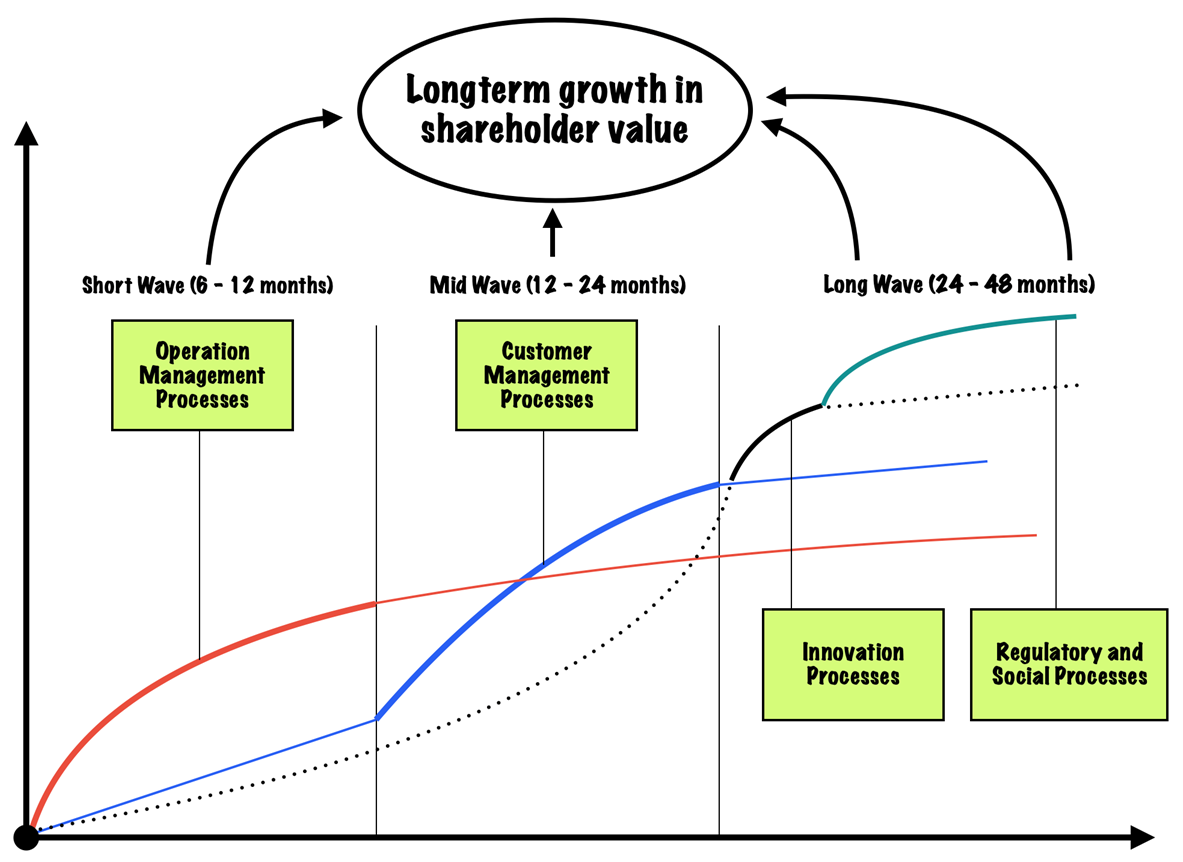
Internal Processes Deliver Value over Different Time Horizons
Typically, the financial benefits from improvements to the processes in the four internal perspective themes occur over different time periods (see figure below).
Cost savings from improvements in operational processes deliver quick benefits (six to twelve months).
Revenue growth from enhancing customer relationships accrues in the intermediate term (twelve to twenty-four months). Innovation processes generally take longer to produce revenue and margin improvements (twenty-four to forty-eight months).
The benefits from regulatory and social processes can take much longer to capture as companies enhance their image as employers and suppliers of choice in every community in which they operate.
Learning and growth perspective: strategic alignment of intangible assets
The learning and growth perspective forms the foundation of a strategy map and defines the core competencies and skills, the technologies, and the corporate culture needed to support an organization’s strategy.
These intangible assets enable a company to align its human resources and information technology with its strategy and are broadly arranged into three categories:
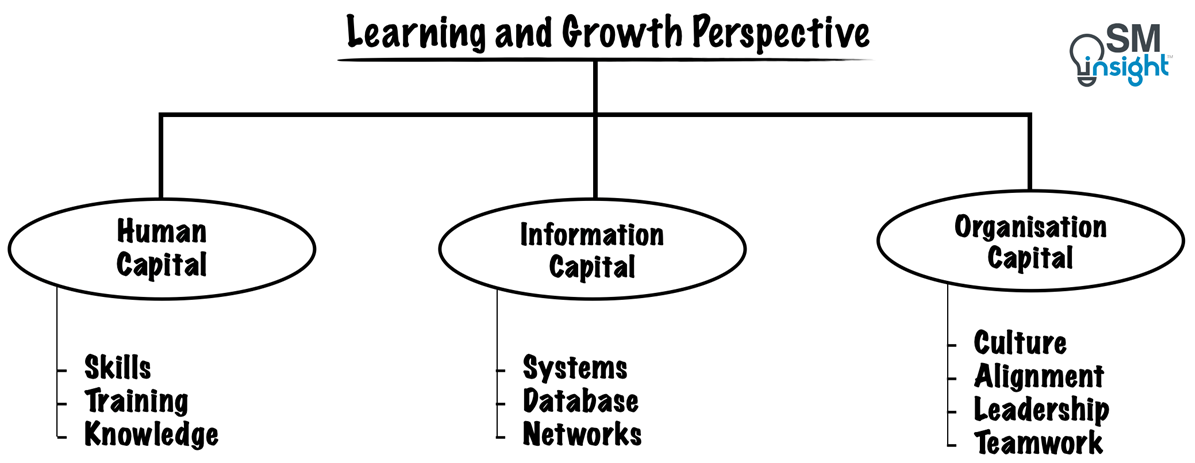
Human capital is the availability of skills, talent, and know-how required to support the strategy.
Information capital is the availability of information systems, networks, and infrastructure required to support the strategy.
Organizational capital represents the ability of the organization to mobilize and sustain the process of change required to execute the strategy. It represents the climate for action – the cultural shifts needed to motivate, empower, and align the workforce behind the strategy.
The learning and growth perspective of a strategy map enables executives to pinpoint specific human, information, and organizational capital required by the strategy.
Putting it together: the generic strategy map template
The below figure puts together the four perspectives discussed thus far into a generic template for creating a strategy map:
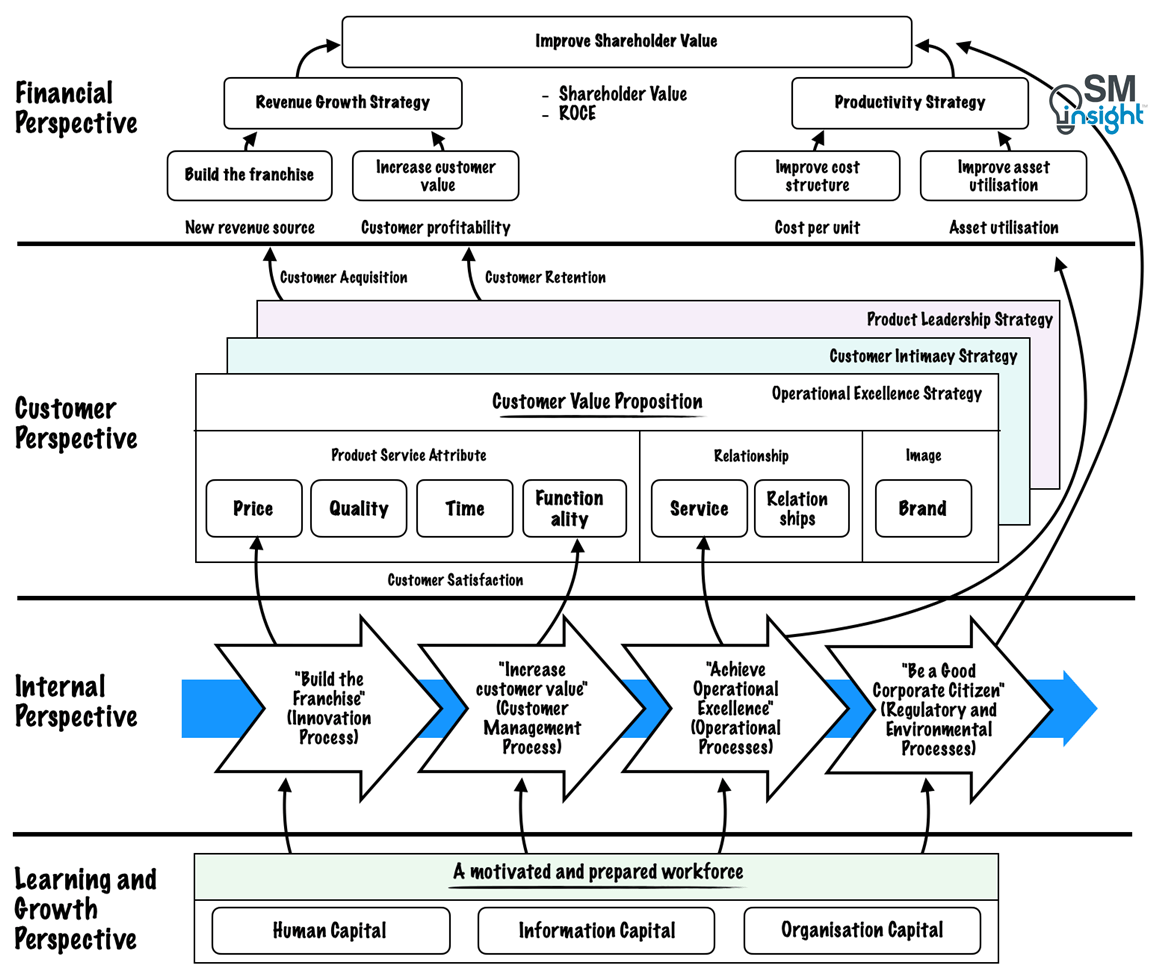
This template can be used by executives to describe their strategy and exponentially improve the quality of insights. They facilitate greater precision in defining financial goals, customer value propositions, internal processes, competencies, and technology while making explicit the interlinkages that exist between them.
Thus, strategy maps help describe an organization’s strategy in a more disciplined way that increases the likelihood of its successful implementation. It helps view their strategies in a cohesive, integrated, and systematic way often exposing gaps and enabling executives to take early corrective actions.
They foster a cause-and-effect mentality that also encourages innovative approaches to strategy implementation.
Sources
1. “Linking the Balanced Scorecard to Strategy”. Harvard Business Publishing, https://store.hbr.org/product/linking-the-balanced-scorecard-to-strategy/CMR073. Accessed 19 Sep 2023
2. “The Balanced Scorecard: Translating Strategy into Action”. Robert S. Kaplan and David P. Norton, https://www.hbs.edu/faculty/Pages/item.aspx?num=8831. Accessed 19 Sep 2023
3. “The Strategy-Focused Organization: How Balanced Scorecard Companies Thrive in the New Business Environment”. Robert S. Kaplan and David P. Norton, https://store.hbr.org/product/the-strategy-focused-organization-how-balanced-scorecard-companies-thrive-in-the-new-business-environment/2506. Accessed 19 Sep 2023
4. “Strategy Maps: Converting Intangible Assets into Tangible Outcomes”. Robert S. Kaplan and David P. Norton, https://www.hbs.edu/faculty/Pages/item.aspx?num=15760. Accessed 19 Sep 2023
5. “Having Trouble with Your Strategy? Then Map It”. Harvard Business Review, https://hbr.org/2000/09/having-trouble-with-your-strategy-then-map-it. Accessed 19 Sep 2023
6. “The Strategy-Focused Organization: How Balanced Scorecard Companies Thrive in the New Business Environment”. Robert S. Kaplan and D. P. Norton, https://www.hbs.edu/faculty/Pages/item.aspx?num=5595. Accessed 23 Sep 2023
7. “Strategy map”. Wikipedia, https://en.wikipedia.org/wiki/Strategy_map. Accessed 19 Sep 2023