What is Six Sigma
Six Sigma (6σ, 6 sigma) is a data-driven and customer-focused approach to improving the quality and efficiency of business processes. It aims to reduce variation and defects in products or services and to achieve near-perfection in meeting customer expectations.
Six Sigma was developed by Motorola in the 1980s and popularized by General Electric in the 1990s. Since then, it has been adopted by many organizations across various sectors and domains.
The overarching premise of Six Sigma is that variation in a process leads to opportunities for error which then leads to risks for product defects. Product defects, whether in a tangible process or a service, lead to poor customer satisfaction. By working to reduce variation and opportunities for error, the Six Sigma method aims to reduce process costs and increase customer satisfaction.
When applied to business processes, Six Sigma allows companies to drastically improve their bottom line by designing and monitoring everyday business activities in ways that minimize waste and resources while increasing customer satisfaction.
Six Sigma and Statistics
At the most basic definition, Six Sigma is a statistical representation of what many experts call a “perfect” process.[1]
Technically, in a Six Sigma process, there are only 3.4 defects per million opportunities. In percentage terms, it implies that 99.99966 percent of the products from a Six Sigma process are without defects.
Six Sigma is both a methodology for process improvement and a statistical concept
that seeks to define the variation inherent in any process.
Importance of Six Sigma
According to the ATO Fact Book, the US Federal Aviation Administration’s air traffic management system handled a total of 15,416,640 flights in FY2022.[2] The table below shows the defect occurrence per million for various σ levels:
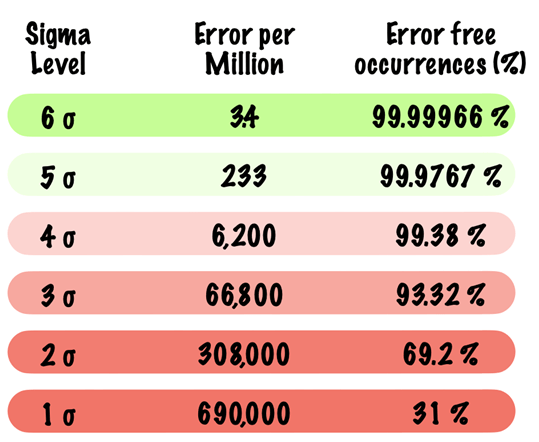
Based on a 5σ air traffic control process, errors of some type would have occurred in the process of handling approximately 3,592 flights in FY2022. With a 6σ process, that risk drops to 52.42 errors!
While most people accept a 99.9 percent (5σ) accuracy rate in even the most critical services on a daily basis, the above examples highlight how wide the gap between Six Sigma and Five Sigma really is.
For organizations, it’s not just about the error rate, it’s also about the costs associated with each error.
Consider the example of Amazon which shipped an estimated 7.7 billion packages globally in 2021 amounting to about $470 billion in sales.[3] If each erroneous order costs the company an average of $20 (a very conservative number), the cost of error for Amazon at various Sigma levels is as below:
| Cost of error at various σ levels for Amazon’s 7.7 billion shipments in 2021 | |||
| Sigma Level | Errors | Average cost per Error | Total cost of Error ($) |
| 6σ | 26,180 | $ 20 | $ 523,600 |
| 5σ | 1,794,100 | $ 20 | $ 36 million |
| 4σ | 47,740,000 | $ 20 | $ 955 million |
| 3σ | 514,360,000 | $ 20 | $ 10 billion |
| 2σ | 2,371,600,000 | $ 20 | $ 47 billion |
| 1σ | 5,313,000,000 | $ 20 | $ 106 billion |
The cost difference between a 5σ (99.99% accuracy) and a 6σ would mean over $35 million in annual savings for Amazon. From the above table, it is also evident how a drop in sigma level exponentially increases the cost a company incurs.
Origin of Six Sigma
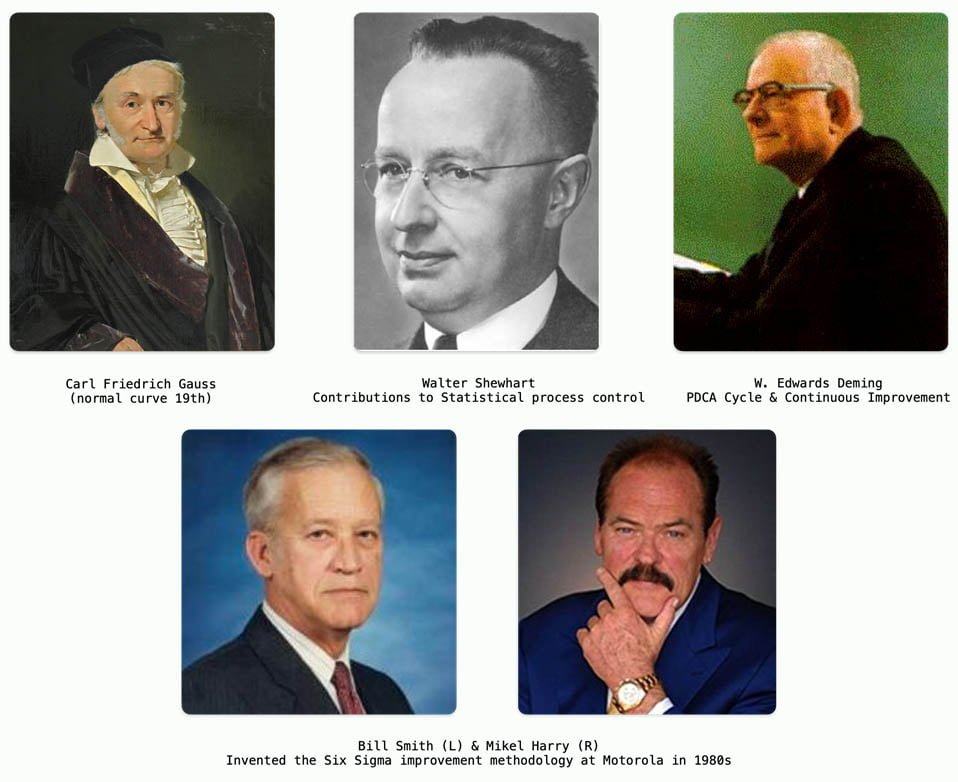
The roots of statistical process control (SPC), which provide a backbone for Six Sigma methods, began with the development of the normal curve by Carl Friedrich Gauss[4] in the 19th century.
In the early part of the 20th century, SPC received another big boost due to several contributions from Walter Shewhart[5], an engineer and scholar. Among his numerous contributions, two specifically stand out when speaking of Six Sigma:
First, Shewhart closely related sigma level and quality and showed that three sigma from the mean is the point where a process requires correction. Second, he introduced Control charts, which are a critical component of SPC that lets organizations maintain improved performance after a Six Sigma initiative.
During the same time, W. Edwards Deming[6] introduced the Plan-Do-Check-Act Cycle (PDCA) that stressed the importance of continuous improvement – a core tenet of Six Sigma.
Following World War II, Deming worked as a consultant to Japanese manufacturing companies and planted the ideas and concepts that would soon become the Toyota Production System or Lean Six Sigma.
In the 1980s, Bill Smith[7] moved to Motorola as the company was intensifying its quality initiatives to catch up with Japanese competitors. Bill had been brought in to share Japanese quality methods that he had learned while in the country with Motorola.
It was there that Bill Smith along with Mikel Harry[8] invented the Six Sigma improvement methodology, sharing the concept and theory with the CEO and going on to develop it thereafter.
Motorola registered Six Sigma as a service mark[9] in 1991, and as a trademark in 1993.[10] Six Sigma helped the company realize powerful bottom-line results. Motorola claims to have achieved more than $16 Billion in savings because of its Six Sigma efforts.[11]
Since then, companies as diverse as Allied Signal (now Honeywell), General Electric, Sony, Honda, Maytag, Raytheon, Texas Instruments, Bombardier, Canon, Hitachi, Lockheed Martin, and Polaroid have all adopted Six Sigma.
America’s greatest business leaders such as Larry Bossidy of Allied Signal, and Jack Welch of General Electric Company have praised Six Sigma. General Electric’s implementation of Six Sigma which took five years, reportedly resulted in $12 billion savings.[12]
Common Six Sigma principles
Organizations can impact their Sigma level by integrating the core principles of Six Sigma into leadership styles, process management, and improvement endeavors. These core principles are:[13]
Customer Focused improvement
Companies launching Six Sigma are often shocked to find out how little they understand about their customers. In Six Sigma, customer focus becomes the top priority. The measures of Six Sigma performance begin with the customer with improvements defined by their impact on customer satisfaction and value.
Process-Focused approach
Six Sigma positions the process as the key vehicle of success. From designing products and services to measuring performance to improving efficiency and customer satisfaction, Six Sigma advocates that mastering processes is the way to build a competitive advantage in delivering value to customers.
Data and fact-driven management
Six Sigma promotes the “management by fact” approach. It begins by clarifying what measures are key to gauging business performance and then gathers data and analyzes key variables. Thus, problems can be effectively defined, analyzed, and permanently resolved.
At a more down-to-earth level, Six Sigma helps managers answer two essential questions to support data-driven decisions and solutions.
- What data/information do we really need?
- How do we use that data/information to maximum benefit?
Proactive management
Six Sigma encompasses tools and practices that replace reactive habits with a dynamic, responsive, and proactive style of management. By defining ambitious goals that are reviewed frequently, priorities become clear and the focus shifts to problem prevention rather than firefighting and questioning. This often becomes a starting point for creativity and effective change.
Boundaryless collaboration
Six Sigma promotes boundarylessness collaboration that breaks down across organizational lines to improve teamwork. This unlocks opportunities through improved collaboration among companies, vendors, and customers. Billions of dollars are lost every day because of disconnects and outright competition between groups that should be working for a common cause: providing value to customers.
Drive for perfection and tolerate failure
A company that makes Six Sigma its goal will have to keep pushing to be ever more perfect while being willing to accept and manage occasional setbacks. Six Sigma techniques that improve performance also include risk management tools that limit the downside of setbacks or failures. No company will get even close to Six Sigma without launching new ideas and approaches that always involve some risk.
The Six Sigma problem-solving process: DMAIC and DMADV
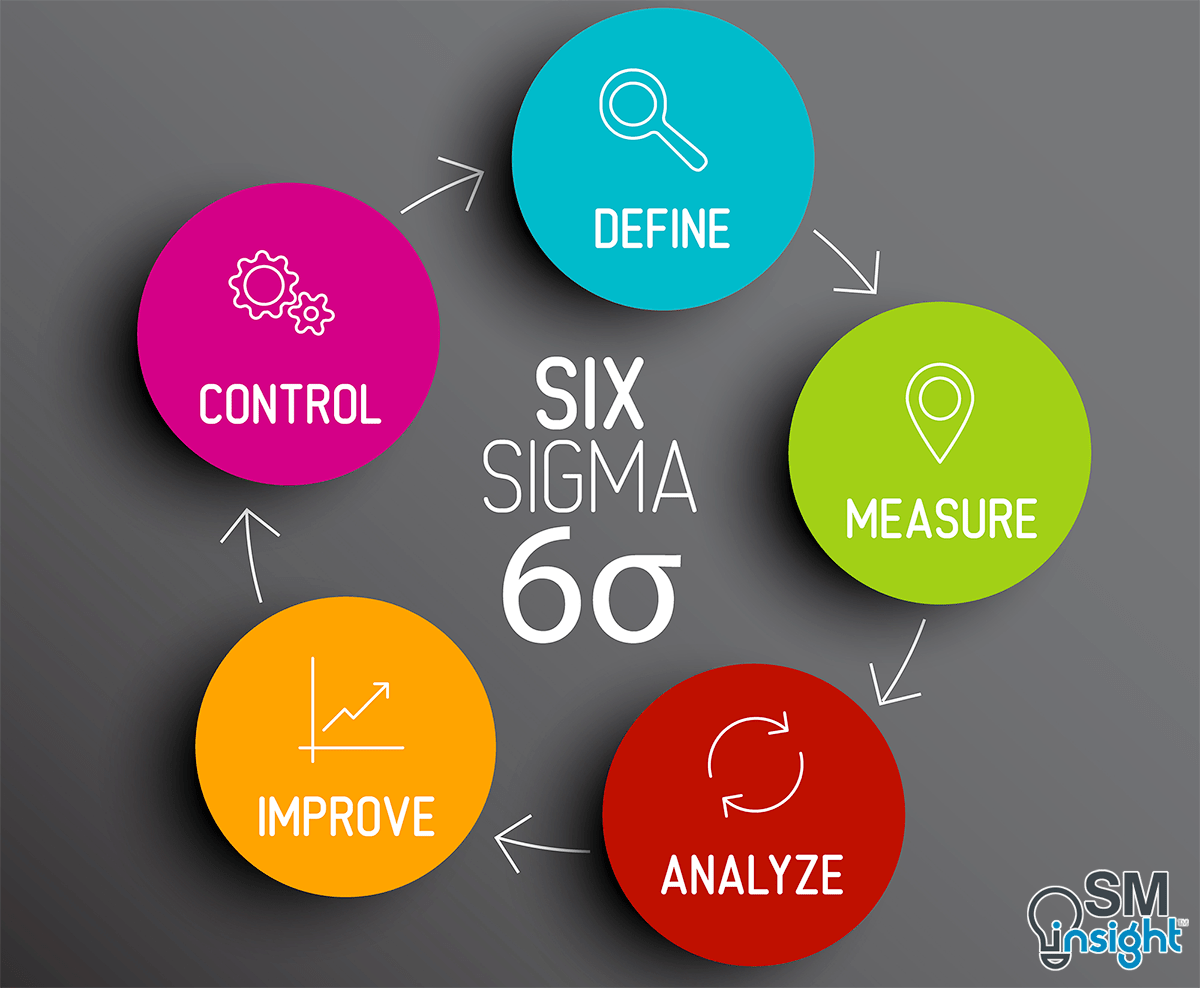
Six Sigma projects that are meant to improve an existing process follow a roadmap for success known as the DMAIC process (pronounced duh-MAY-ick).
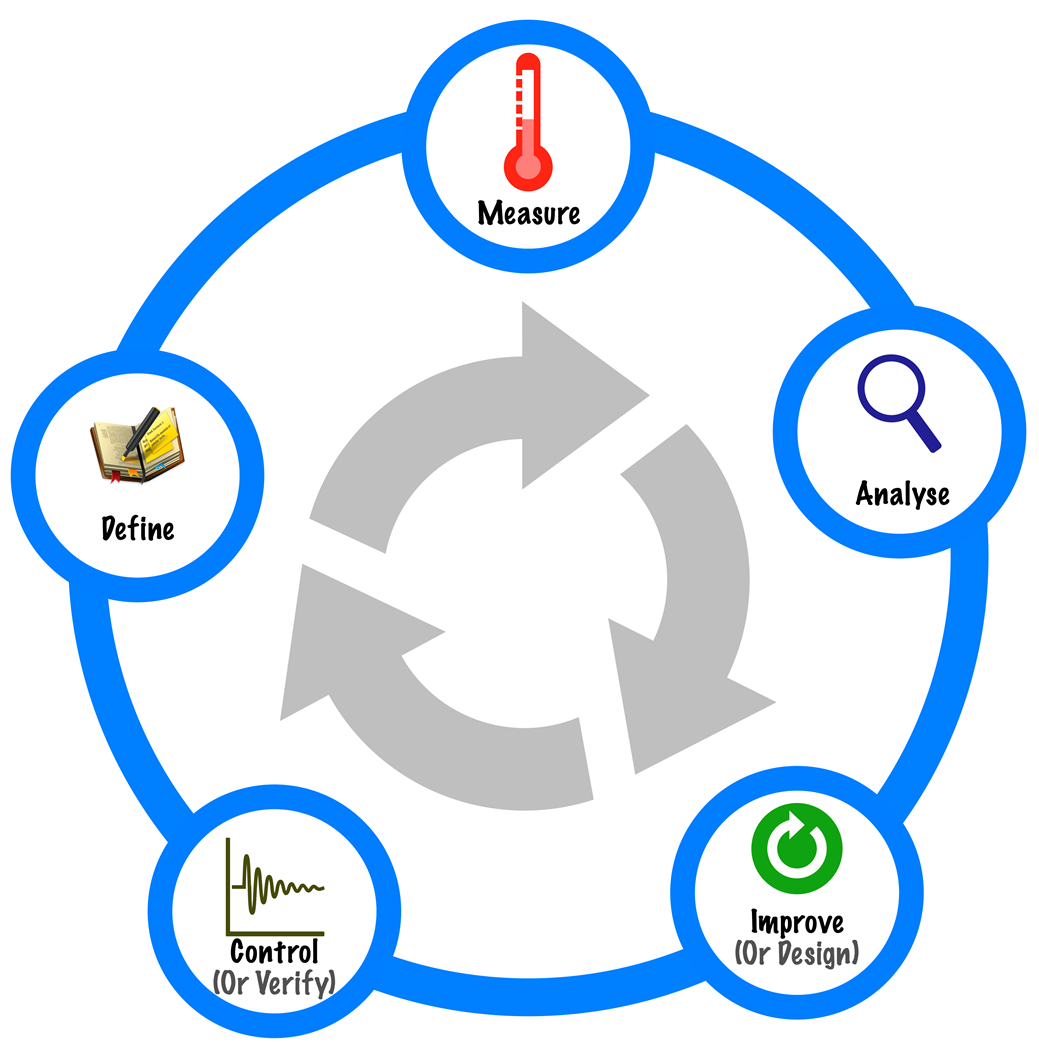
DMAIC is broken into five phases: Define, Measure, Analyze, Improve, and Control. The main activities of a DMAIC project include identifying the critical inputs or causes that are creating the problem, verifying those causes, brainstorming and selecting solutions, implementing solutions, and creating a control plan to ensure the improved state is maintained.
In some cases, teams realize that fixing an existing process may not achieve sustained improvement, instead, a process might need to be completely redesigned. In such cases, teams employ the DMADV method.
DMADV stands for Define, Measure, Analyze, Design, and Verify. The principles governing the method are similar to DMAIC, but the last two phases are geared toward rolling out and testing a completely new process.
Define
In DMAIC define phase, the project requirements are identified, and goals for success are set. Requirements and goal setting might relate to a variety of factors and are dependent on guidance from the leadership and expected budgets.
In a DMADV project, the define phase is more rigid. The teams must also define customer requirements to create a measuring stick to which the process development can be compared.
In both DMAIC and DMADV, teams create a project charter and a basic work plan. A charter is a synopsis of the project and provides common information and a summary of what the team hopes to accomplish. The charter also features a list of team members, names of those responsible for outcomes, a problem statement, a goal, and some basic definitions of scope and metrics for success.
Tools like the SIPOC diagram and Stakeholder Analysis(discussed later) can be used to understand processes and key stakeholders.
Measure
The bulk of the measure phase in DMAIC is occupied with gathering data and formatting it in a way that can be analyzed. Teams build tools to capture data, create queries for digital data, sift through enormous amounts of data to find relevant information or capture data by hand in some manual process.
The Measure stage validates assumptions from the Define stage with actual data. It might be required to revisit problem statements, goals, and other process-related definitions. The define stage creates a “rough draft” while the measure converts that into a final one.
In DMADV, the approach is similar, but activities are typically more targeted. Teams collect data and measurements that help define performance requirements for the new process.
Deciding what to measure can be challenging and requires strong observation skills, an understanding of the reasons behind the measure, knowledge of data types such as discrete and continuous, tools for measurement assessment, and a strong background in statistical analysis.
Analyze
In the Analyze phase of DMAIC, hypotheses are developed about causal relationships between inputs and outputs. Causations are narrowed down to the vital few using methods such as the Pareto analysis (discussed later). Using statistical analysis and data, hypotheses and assumptions are validated.
In a DMAIC project, Analyze phase tends to flow into the Improve phase. Hypothesis testing, assumption validation and possible solutions might begin in Analyze and continue into the Improve phase.
Likewise, in a DMADV project, teams also identify cause-and-effect relationships, but they are more concerned with identifying best practices and benchmarks by which to measure and design the new process.
Teams begin the process design work by identifying value-added and non-value-added activities, locating areas where bottlenecks or errors are likely, and refining requirements to meet the needs and goals of the project.
The lines between Measure and Analyze are often blurrier than the lines between Define and Measure. In some cases, a team must measure, analyze, and then measure some more, particularly if metrics aren’t already in place for a process.
During the Analyze phase, teams use a variety of tools like Pareto Charts, Run Charts, Histograms, Cause-And-Effect Diagrams, Scatter Diagrams, Process Maps, and Value Analysis (all of which are discussed later).
Improve or Design
Six Sigma teams start developing the ideas that began in the Analyze phase during the Improve phase of a project by using statistics and real-world observation to test hypotheses and solutions.
Solutions are standardized in preparation for rolling improved processes to daily production and non-team employees. Teams also start measuring results and laying the foundation for controls that will be built in the last phase.
In the Improve phase, the DMADV project begins to diverge substantially. New processes are designed, which does involve some solutions testing (as in DMAIC), but also mapping workflow principles and actively building new infrastructures.
This might mean putting new equipment in place, hiring and training new employees, or developing new software tools.
As solutions are narrowed down, more than one might appear compelling and it can get challenging to determine which of the solutions improve a process. In such cases, changes are implemented one at a time and verified before moving on to the next.
Tools like the Solutions Selection Matrix (discussed later) can be used to evaluate and choose the best solutions.
Control or Verify
Control/Verify phase is where loose ends are tied and the project is transitioned to a daily work environment. Controls and standards are established so that improvements can be maintained and the responsibility for those improvements is transitioned to the process owner.
In DMAIC, teams usually handle four tasks:
- creating the foundation for process discipline
- finalizing documents related to the improvement
- establishing ongoing metrics to evaluate the process
- and building a process management plan that lets the team transition the improvement to the process owner.
Tools during the Control phase include documentation checklists, control charts, response plans, process maps, and process dashboards.
Verify phase of DMADV is like the Control phase, but with the exception that teams might perform further critical-to-quality (CTQ) analysis (discussed later) at the end of a project to identify new CTQ factors.
This is essential as the process/product could be different from when the team started working. At the end of the Verify phase, the final product or a process that meets the needs first identified in the Define stage is delivered.
When to use DMAIC and DMADV?
| Situation | Method | Why |
|---|---|---|
| A business wants to create a smartphone app to help customers make and manage appointments. | DMADV | The business wants to create a product that doesn’t yet exist. |
| A doctor’s office has had numerous complaints from patients because it is too hard to get appointments, appointment communications are confusing, or patients show up for appointments and are told they don’t have an appointment. | DMAIC | Since there is an existing process that needs improvement, begin with a DMAIC approach. If the team realizes the need for a new process, they may switch to DMADV. |
| A company that manufactures pizza boxes isn’t happy with the profit margins in the small-size boxes. | DMAIC | The problem hasn’t yet been defined, but the organization knows that goals and expectations are not being met. |
Why are the DMAIC and DMADV models effective?
The DMAIC/DMADV model provides seven key advantages:
- Measuring the problem: In DMAIC, teams just don’t assume that they understand the problem, they are required to prove (validate) it with facts.
- Focus on the customer: The process always considers the external customer’s interests which is important, especially when an organization is trying to cut costs in a process.
- Verifying root cause: Teams agreeing on a cause is not proof enough. Teams must prove their cause with facts and data.
- Breaking old habits: DMAIC/DMADV projects have proven to go beyond minor changes in crusty old processes and drive real change and results through creative new solutions.
- Managing risks: Testing and perfecting solutions is embedded within the process which mitigates risks.
- Measuring results: Solutions and their impact are verified through facts with goals and metrics clearly defined.
- Sustaining change: Even the best of new “best practices” developed by a DMAIC team can die quickly if not nurtured and supported. Making change is the final key and part of this problem-solving approach.
The Six Sigma toolkit
Any technique that helps better understand, manage, and improve a business or a process can qualify as a Six Sigma tool, but some of them are key to planning and executing Six Sigma projects.
Understanding these tools gives a clearer perspective on how Six Sigma works. These tools are bunched into four categories:
- Tools for generating ideas and organizing information
- Tools for data gathering
- Tools for process and data analysis
- Tools for statistical analysis
The goal of this article is to provide a quick overview of each of these tools. More details and how-to information can be found in a variety of other books and websites.
Tools for generating ideas and organizing information
1. Brainstorming
Many Six Sigma methods have brainstorming, or idea generation, as a starting point. Brainstorming is an idea-creation method for generating many creative ideas in a short period. Brainstorming can be used when:
- A broad range of options is to be generated
- Creative, original ideas are required
- Group participation is desired
During a brainstorming session, all ideas are to be treated as valid and worthy of consideration. At this stage, ideas are not criticized or evaluated. They are to be recorded as-is without discussion. Even combining, modifying, and expanding on others’ ideas is encouraged.
Methods like the “Sticky Storm Technique”[14] that combines individual and group brainstorming can be used.
2. Affinity Diagramming
The Affinity Diagram[15] (also known as Affinity Chart, Affinity Mapping, K-J Method, or Thematic Analysis) groups ideas according to their natural relationships. It usually follows the brainstorming stage to help organize the output.
It can be used to organize and consolidate information related to a product, process, complex issue, or problem. Ideas are grouped according to their affinity or similarity.
Teams creating affinity diagrams record each idea on a note or a card. They then look for relationships between individual ideas and have team members simultaneously sort the ideas into five to ten related groupings. The process is repeated until all ideas are grouped.
It is okay to have “loners” that don’t seem to fit a group. It is also okay to move a note someone else has already moved. If a note seems to belong to two groups, a second note can be made.
It is important to avoid talking during this process. The focus should be on looking for and grouping related ideas without attaching any priority or importance to them.
3. Multivoting
Multivoting[16] narrows a large list of possibilities to a smaller list of top priorities. Each participant gets a certain number of votes (unlike a single vote in straight voting). This allows an item that is favored by all, but not the top choice of any, to rise to the top.
Multivoting can be used:
- After brainstorming generates a long list of possibilities
- When a list must be narrowed down
- When a decision must be made by group judgment
4. Structure Tree (Tree Diagram)
A Structure Tree[17] (also known as Systematic Diagram, Tree Analysis, Analytical Tree, or Hierarchy Diagram) is used to depict the hierarchy of tasks and subtasks needed to complete an objective.
The tree diagram starts with one item that branches into two or more, each of which branches into two or more, and so on. The finished diagram bears a resemblance to a tree, with a trunk and multiple branches.
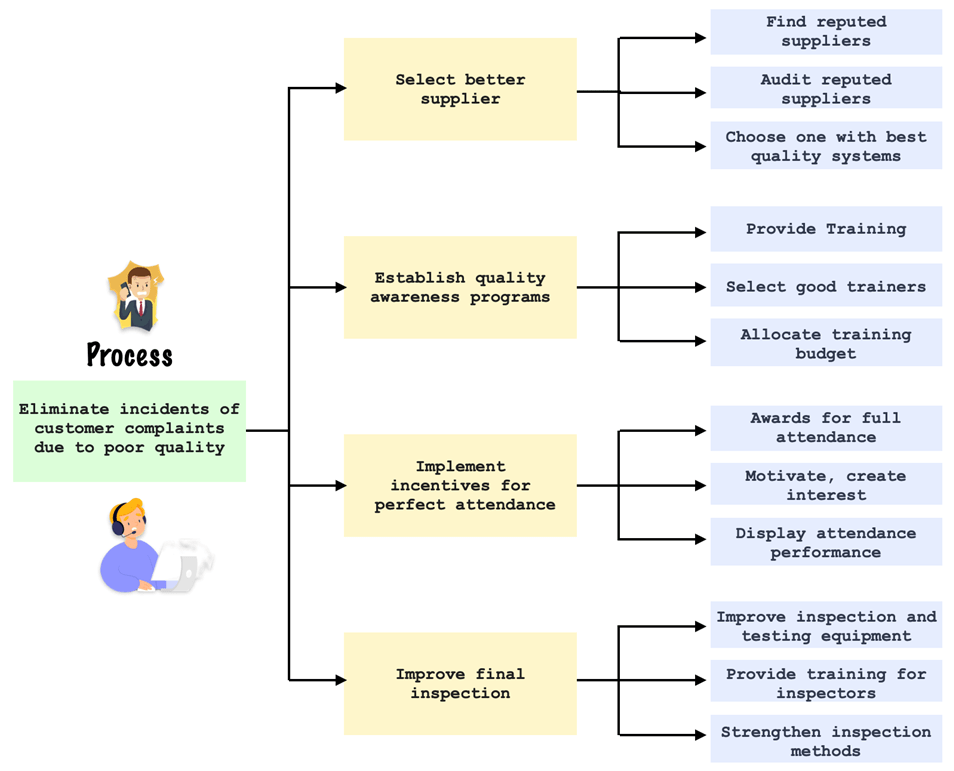
As seen from the figure above, a tree diagram breaks down broad categories into finer levels of detail. Developing the tree diagram helps teams to think step by step from generalities to specifics.
A tree diagram can be used when:
- An issue, that is known in broad generalities must move to specific details
- Developing actions to carry out a solution or a plan
- Analyzing processes in detail
- Probing for the root cause of a problem
- Evaluating implementation issues for several potential solutions
- After an affinity diagram or interrelationship diagram has uncovered key issues
- As a communication tool, to explain details to others
5. High-level process map (SIPOC diagram)
SIPOC[19] (pronounced “sye-pahk”) is an acronym for Supplier, Input, Process, Output, Customer. SIPOC is used in the Define phase of DMAIC and is often a preferred method for diagramming major business processes and identifying possible measures.
SIPOC shows the major activities or sub-processes in a business in a systematic framework represented by the Suppliers, Inputs, Processes, Outputs, and Customers. This helps identify the boundaries and critical elements of a process without losing sight of the big picture.
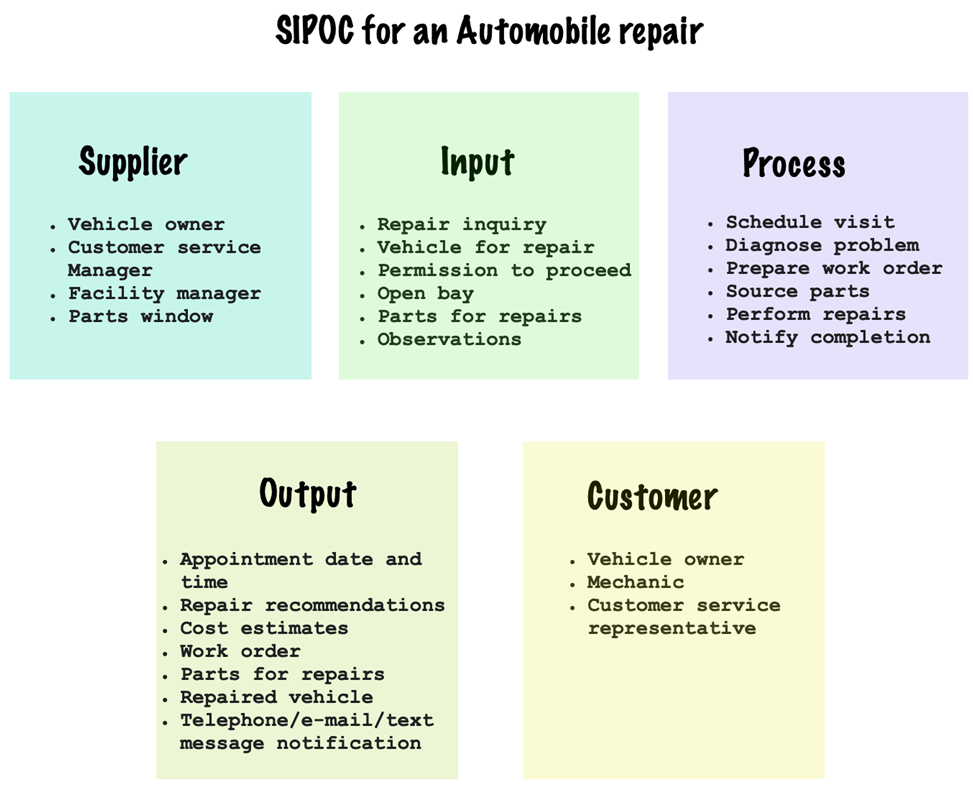
In a SIPOC diagram, suppliers are the sources for the process, inputs are the resources needed for the process to function, the process constitutes the high-level steps that the system/organization undertakes, outputs are the results of those processes and customers are the people who receive outputs or benefit from the process.
Creating a SIPOC diagram helps answer the following questions:
- How can a process be made easier?
- Is a quality product delivered to the customers?
- Can supplier management be improved?
- Are suppliers delivering as per need?
- Are the customer persona and the demographics they fall into known?
- Are there any inefficiencies that can improve when creating the product?
Sometimes, a variation of the SPCIF diagram called SIPOC+CM[21] is used that also maps the Constraints (C) and the Measures (M).
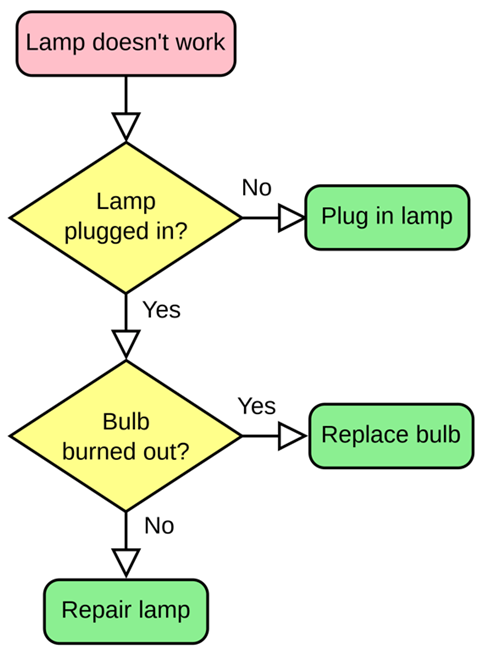
6. Flowchart
A Flowchart[22] is used to show details of a process, including tasks and procedures, alternative paths, decision points, and rework loops. While simple flowcharts can be constructed with a bunch of stickies on a wall, complex ones are developed using advanced software[23] that offers extensive capabilities.
A flowchart is a visual representation of distinct steps of a process in sequential order. Elements that may be included in a flowchart are a sequence of actions, materials or services entering or leaving the process (inputs and outputs), decisions that must be made, people who become involved, time involved at each step, and/or process measurements.
Flowcharts can be used:
- To develop an understanding of how a process is done
- To study a process for improvement
- To communicate to others how a process is done
- For better communication among people involved with the same process
- To document a process
- When planning a project
7. Fishbone diagram
A Fishbone diagram[25] (also known as Cause-And-Effect Diagram, Ishikawa Diagram) is used to brainstorm possible causes of a problem (or effect) and puts the possible causes into groups or affinities. Causes that lead to other causes are linked similarly to a structure tree.
The fishbone diagram helps gather collective ideas from the team on where a problem might arise and enables the team members to think of all possible causes by clarifying major categories.
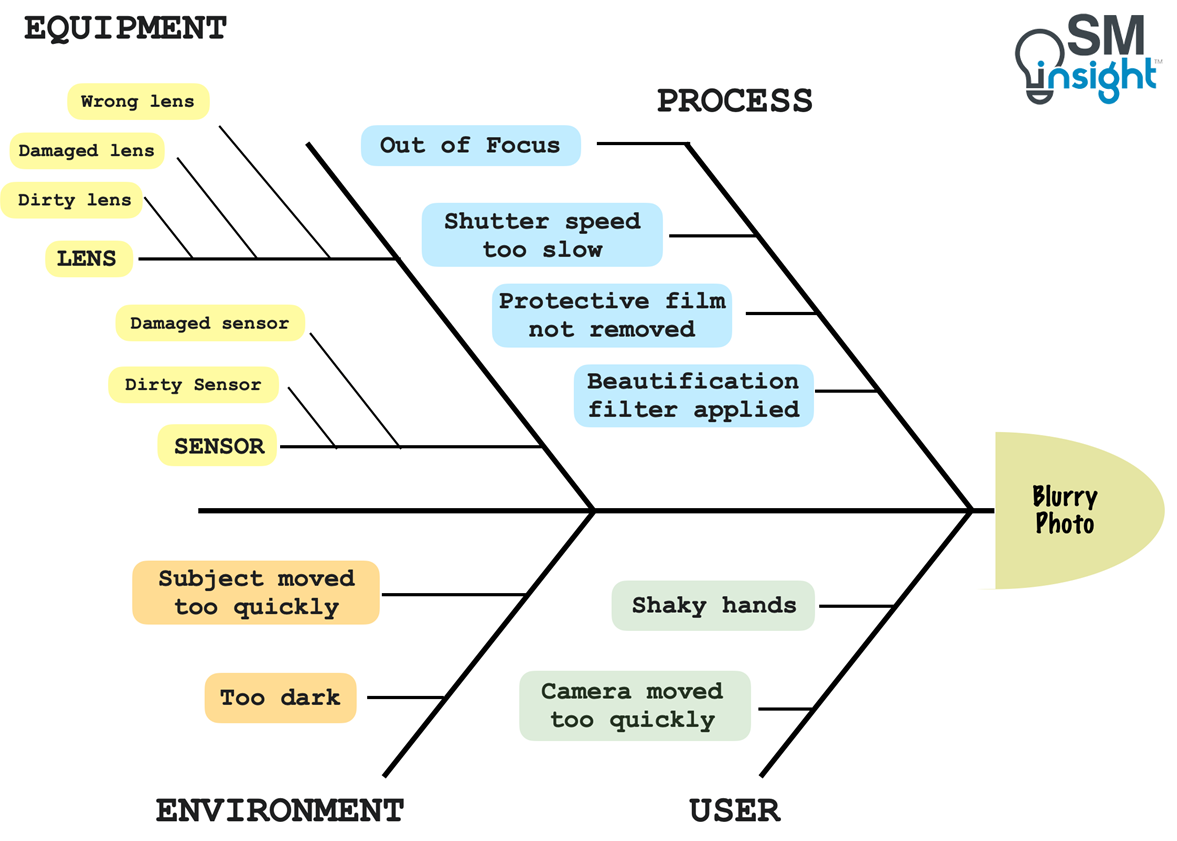
While a fishbone diagram does not reveal the right cause, it helps develop educated guesses, or hypotheses, about where to focus measurement and further root cause analysis.
A fishbone diagram can be used:
- When identifying possible causes for a problem
- When a team’s thinking tends to diverge
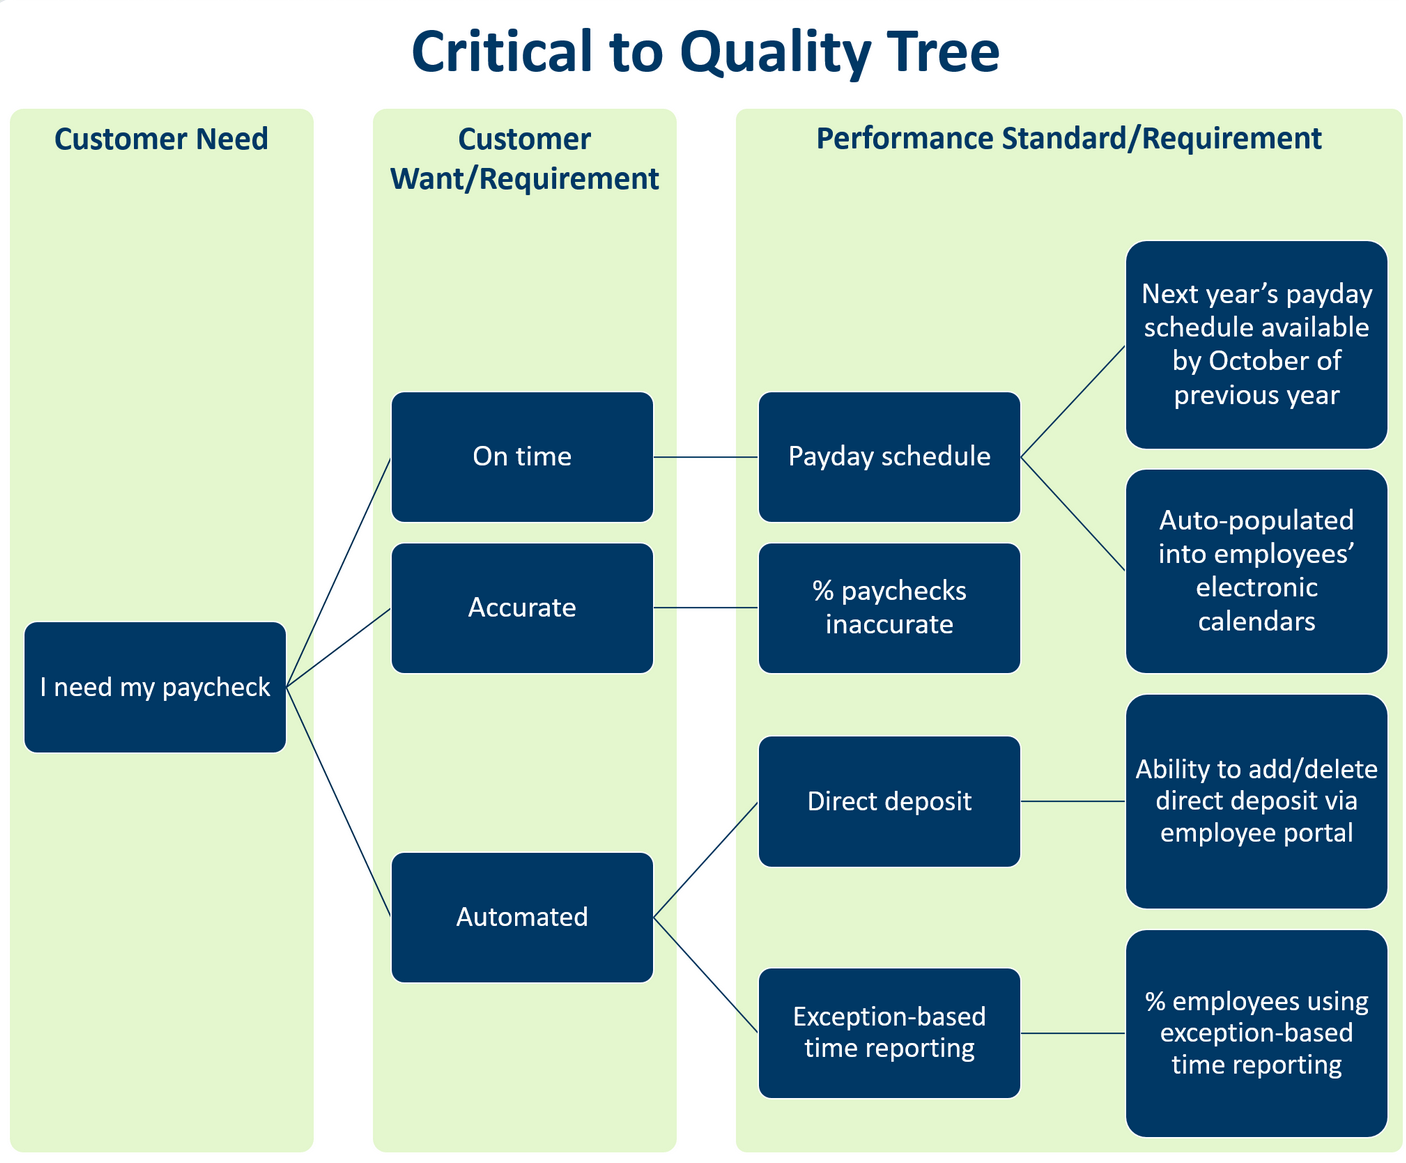
8. Critical to Quality (CTQ) tree
A CTQ tree[27] is a visual tool to identify and prioritize the critical quality characteristics (CTQs) that are most important to customers. It helps map the relationship between customer requirements and specific product or process characteristics for improvement focus.
A CTQ tree starts by identifying the customer needs and then branches into drivers and requirements. Building a CTQ tree requires identifying:
- The Need: This is the actual product or service that a customer wants.
- The Drivers: These are quality drivers that must be present to fulfil customer needs.
- The Requirements: These are the list of the requirements for each driver. In other words, recording measurable performance metrics for each driver.
In Six Sigma, once an organization has completed the Voice of Customer (VOC) process, it is useful to build a CTQ tree to:
- Bring more clarity in understanding customer needs
- Identifying current issues and improving the product or service
- Help design or develop a product or service during the early stages of the process
- Stand out from competitors
Tools for data gathering
1. Sampling
Sampling[28] is the selection of a set of elements from a target population or product lot. Sampling is used frequently as gathering data on every member of a target population or every product is often impossible, impractical, or too costly.
Sampling helps draw conclusions or make inferences about the population or product lot from which the sample is drawn.
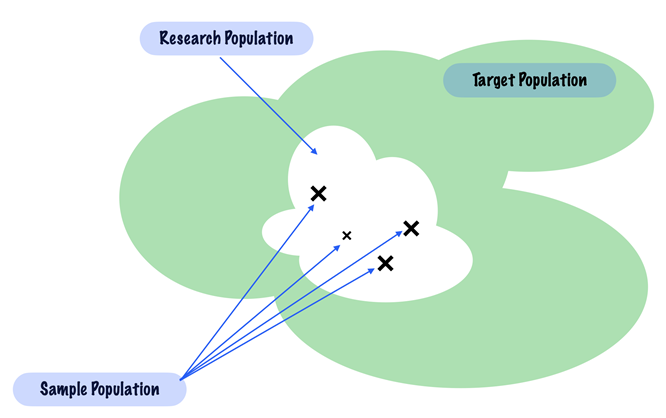
When used in conjunction with randomization[29] (randomly selecting factors, measurements, or variables to eliminate the effects of bias or chance), samples provide virtually identical characteristics relative to those of the population or product grouping from which the sample was drawn.
Teams must be careful to avoid sampling errors which are primarily of three kinds:
- Bias (lack of accuracy)
- Dispersion (lack of precision)
- Non-reproducibility (lack of consistency)
2. Operational Definitions
An Operational Definition[30] is a clearly defined description of some characteristic. It should be specific and describe not only what is being measured but how. An operational definition needs to be agreed upon by all parties, whether that is a customer or an internal function of the organization.
For example, an Amazon search for “blue shirt” will yield the following result:

This is the key purpose of an operational definition. Everyone must define, measure, and interpret things the same way.
3. Voice Of The Customer (VOC) Methods
Voice Of the Customer (VOC)[31] is the direct input and expression of the wants, needs, and expectations that the customer has for the organization with which the customer conducts business.
In Six Sigma, VOC is the structured process of directly soliciting and gathering the specifically stated needs, wants, expectations and performance experiences of the customer about the products and/or services that an organization provides.
There are several ways an organization can capture the VOC, such as:
- Direct observations
- Surveys
- Interviews
- Focus groups
- Complaint data
- Customer service reps
- Sales reps
- Existing company data
- Industry data
Unintended miscommunication between an organization and its customers is a common reason why organizations lose customers and their business. It is critical for an organization to understand the VOC and customer requirements.
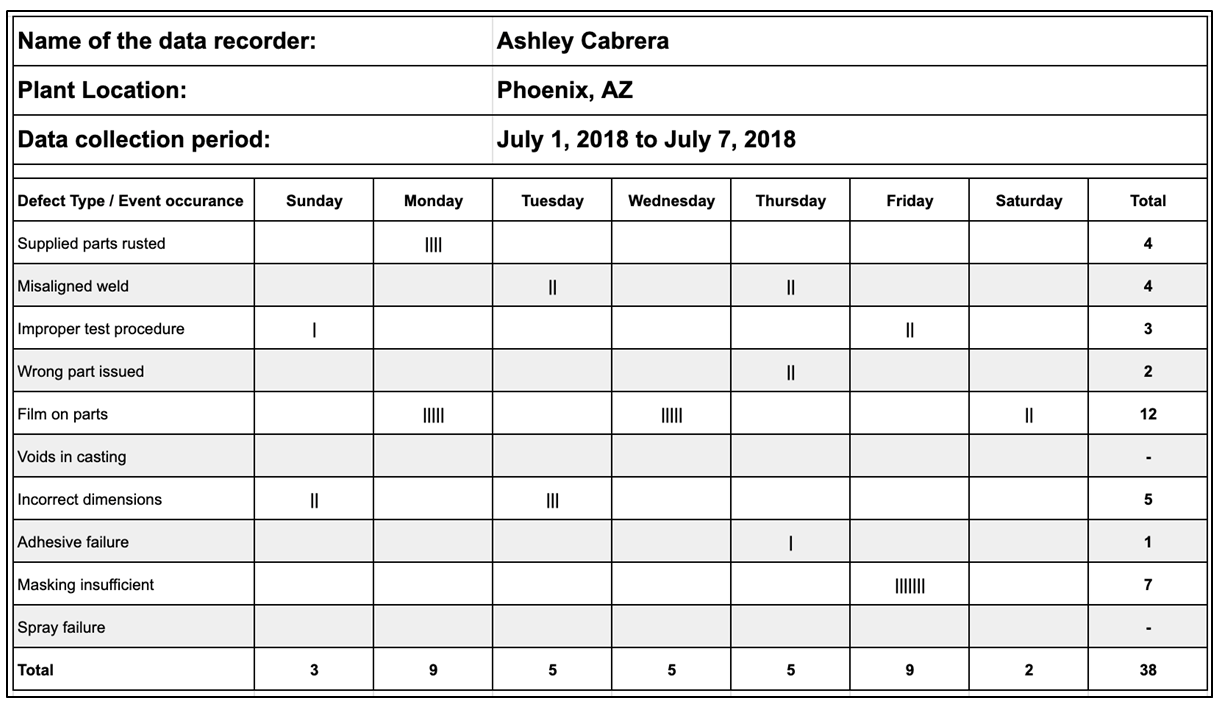
4. Checksheets
A Checksheet[33] (also called a defect concentration diagram) is a structured, prepared form for collecting and analyzing data. It is a generic data collection and analysis tool that can be adapted for a wide variety of purposes and is considered one of the seven basic quality tools.
A checksheet can be used when:
- Data can be observed and collected repeatedly by the same person or at the same location.
- Collecting data on the frequency or patterns of events, problems, defects, defect location, defect causes, or similar issues.
- Collecting data from a production process.
Checklists have two key objectives:
- Ensure that the right data is captured, with all necessary facts included, such as when it happened, how many, and what customer. These facts are called stratification factors.[32]
- To make data gathering as easy as possible for the collectors.
Checksheets can vary from simple tables and surveys to diagrams used to indicate where errors or damage occurred. Spreadsheets are the place where checksheet data is collected and organized. A well-designed spreadsheet makes it much easier to use the data.
5. Measurement Systems Analysis (MSA)
A measurement systems analysis (MSA)[34] is an umbrella term covering various methods used to ensure that measures are accurate and reliable. MSA evaluates the test method, measuring instruments, and the entire process of obtaining measurements to ensure the integrity of data used for analysis and to understand the implications of measurement error for decisions made about a product or process.
An MSA considers the following:
- Selecting the correct measurement and approach
- Assessing the measuring device
- Assessing procedures and operators
- Assessing any measurement interactions
- Calculating the measurement uncertainty of individual measurement devices and/or measurement systems
Common tools and techniques of measurement systems analysis include calibration studies, fixed effect ANOVA[35], components of variance, attribute gage study, gage R&R, ANOVA gage R&R[36], and destructive testing analysis.
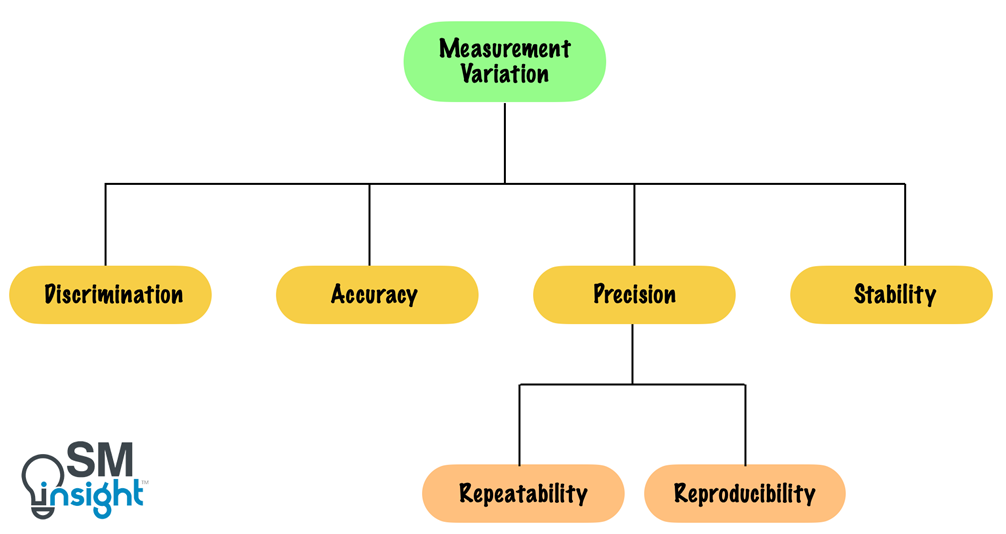
The goals of MSA are:
- Quantification of measurement uncertainty, including the accuracy, precision, repeatability, reproducibility, and discrimination
- Quantifying the stability and linearity of these quantities over time and across the intended range of use of the measurement process.
- Development of improvement plans, when needed.
- Deciding if a measurement process is adequate for a specific engineering or manufacturing application.
Checking on people performing the measurements is also a part of MSA.
Tools for process and data analysis
1. Process-Flow Analysis
A process flow analysis uses the process map or a flowchart as input to scrutinize the process for redundancies, unclear hand-offs, unnecessary decision points, and so on. Process data can reveal problems such as delays, bottlenecks, defects, and rework.
A process flow analysis can be one of the quickest ways to find clues about the root causes of problems.
2. Value and Non-Value-Added Analysis
Activities usually fall under three kinds:
- Value-added activities
- Non-value-added activities
- Business value-added activities
Value-added activities are those activities for which the customer is willing to pay for and non-value-added activities are those for which the customer is not willing to pay.
Business value-added activities are those for which the customer is not willing to pay but are necessary for the running of processes and the business. These could include work performed for audits, controls, risk management, regulatory requirements, etc.
In Six Sigma, both non-value-added and business value-added activities are considered “wastes” but are segregated and treated differently.
Wastes can be identified using the following questions:
- Does the activity transform the form, feature, feeling and function that the customer is willing to pay for?
- Is it being done right the first time?
- Is this something the customer expects to pay for?
A positive answer or a “yes” to all of them indicates that it is a value-added activity. Even a single “No” indicates that it is either a non-value-added activity or a business value-added activity.
It’s never possible to eliminate all non-value-adding activities, especially Business value-added activities, But this approach helps in reducing the non-essential aspects of a process that are a drain on resources.
3. Charts and Graphs:
The first and best way to analyze measures of a process is to create a picture of the data and charts and graphs help accomplish just that. Visual representation of data becomes a lot more meaningful and convenient to read than a table of numbers.
Charts and graphs help make discoveries that the numbers themselves would hide. Charts and graphs are of various types, each offering a bit different picture of the data.
Following are some of the most used types of charts and graphs:
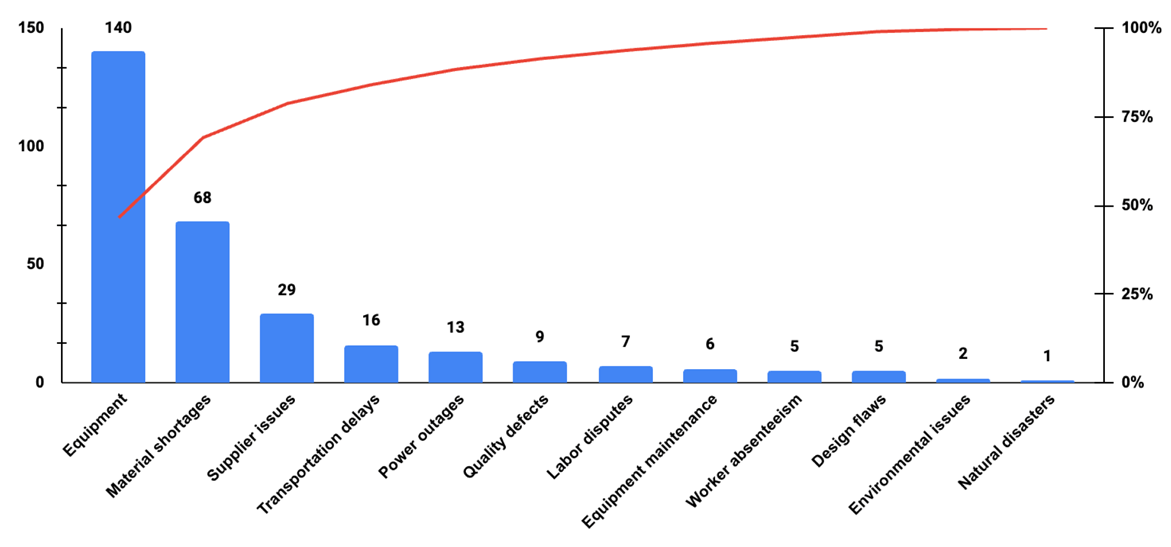
Pareto Chart
A Pareto is a specialized bar chart that breaks down a group by categories and compares them from largest to smallest. It’s used to look for the biggest pieces of a problem or contributors to a cause. Learn more about Pareto analysis.
Histogram (Frequency Plot)
A histogram is a type of bar chart that shows the distribution or variation of data over a range: size, age, cost, length of time, weight, and so on. (A Pareto chart, by contrast, slices data by category)
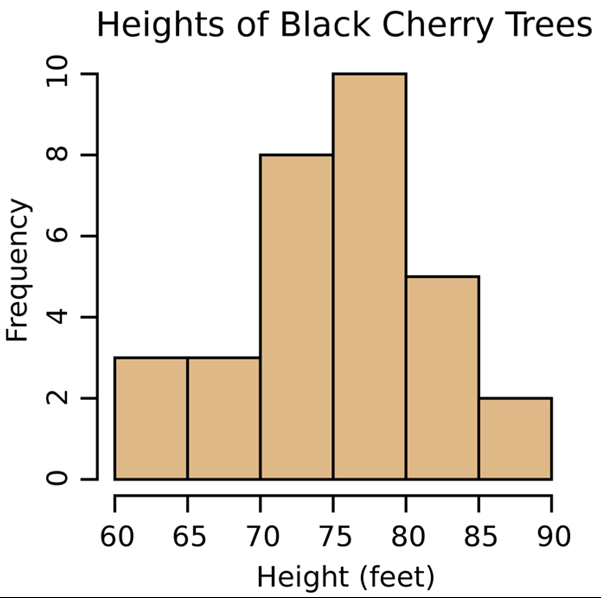
In analyzing histograms, teams can look for the shape of the bars or the curve, the width of the spread, or range, from top to bottom, or the number of “humps” in the bars. When customer requirements are plotted on a histogram, it reveals how much what’s being done meets or does not meet customers’ needs.
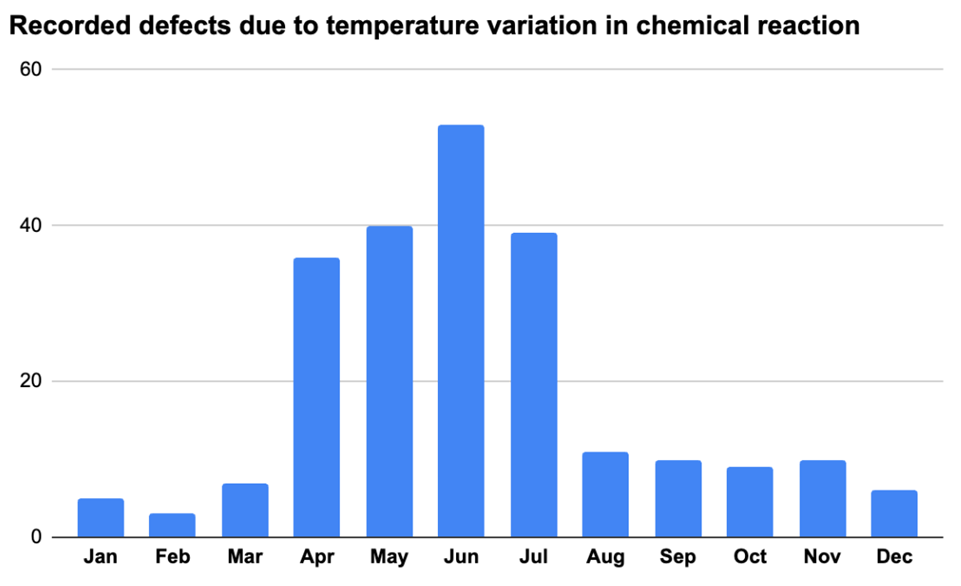
Run (Trend) Chart
Pareto charts and histograms don’t reveal the time dimension, i.e. how things change over time. A run chart accomplishes just that.
Consider the below example of a chemical process that is sensitive to ambient temperature. It can be visually inferred that the temperatures during the months of April through July have a negative bearing on the process leading to defects.
Control Chart
A control chart is also used to study how a process changes over time. Data are plotted in time order. But unlike a Run Chart, a Control Chart always has a central line for the average, an upper line for the Upper Control Limit (UCL), and a lower line for the Lower Control Limit (LCL). These lines are determined from historical data.
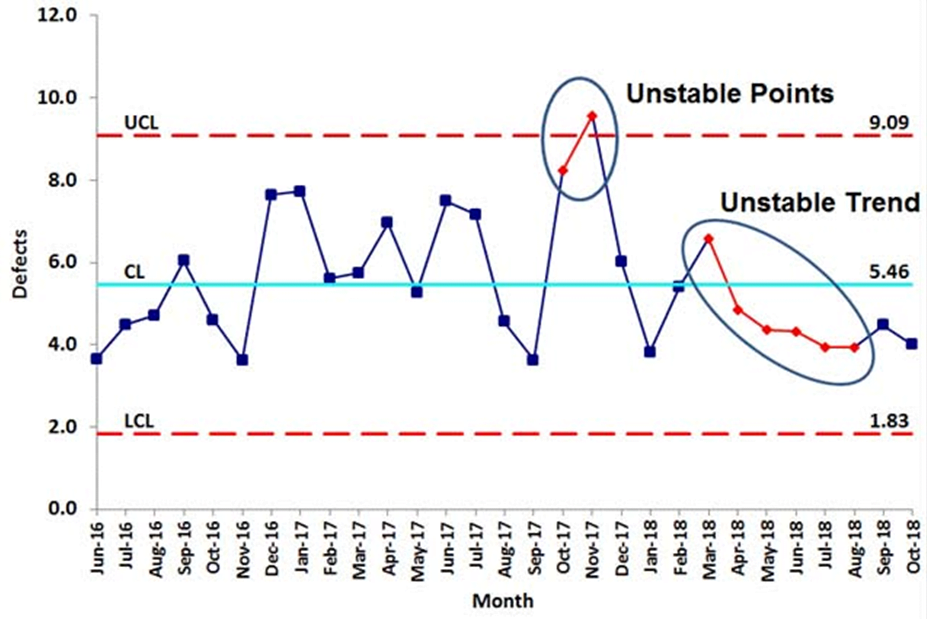
Any data point falling between the UCL and the LCL is considered as safe. The data points falling outside the LCL and the UCL are called ‘Outliers’. All outliers are candidates for Root Cause Analysis.
Control charts are used for:
- Controlling ongoing processes by finding and correcting problems as they occur
- Predicting the expected range of outcomes from a process
- Determining whether a process is stable (in statistical control)
- Analyzing patterns of process variation from special causes (non-routine events) or common causes (built into the process)
- Determining whether a quality improvement project should aim to prevent specific problems or to make fundamental changes to the process
Scatter Plot (Correlation) Diagram
A Scatter plot looks for direct relationships between two factors in a process, usually to see whether they are correlated, meaning that a change in one is linked to a change in the other.
When an increase in one factor matches an increase in the other, it’s a “positive correlation” and likewise the reverse is a “negative correlation”. If two measures show a relationship, one may be causing the other.
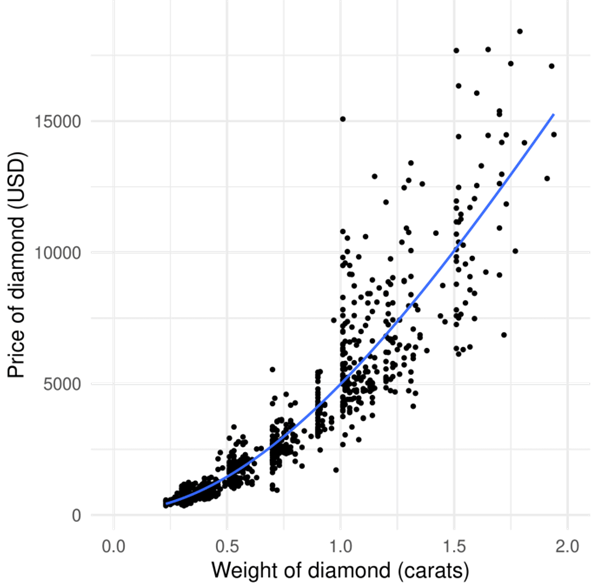
However, a correlation does not necessarily mean causation. The underlying connection may be hidden. For example, there is a statistical correlation between eating ice cream and drowning incidents, but ice cream consumption does not cause drowning. They are connected by a third common cause which is warm summer weather.
A scatter plot helps a DMAIC team visualize the relationship between process output (Y) and suspected cause/input factors (X). As a practice, X is plotted on the horizontal axis (independent variable), while Y is plotted on the vertical axis (dependent variable).
Tools for statistical analysis
In some cases, collected data is not accurate enough. Analysis of such data requires a level of proof beyond what visual tools can offer. Six Sigma teams apply more sophisticated statistical analysis tools in such cases.
The statistical part of the toolkit contains many different tools and formulas. Some of the broad families of statistical methods are:
Tests of statistical significance
These tools look for differences in groups of data to see whether they are meaningful. These tests include Chi-square, t-tests, and analysis of variance.[39]
Correlation and regression
These tools are similar to a scatter plot but can get a lot more complex, including regression coefficients, simple linear regression, multiple regression, surface response tests, and so on. These tools test for the presence, strength, and nature of the links among variables in a process or a product, such as how tire pressure, temperature, and speed would affect gas mileage.[40]
Design Of Experiments (DOE)
DOE deals with planning, conducting, analyzing, and interpreting controlled tests to evaluate the factors that control the value of a parameter or group of parameters. DOE is a powerful data collection and analysis tool that can be used in a variety of experimental situations.
It allows for multiple input factors to be manipulated, determining their effect on a desired output (response). DOE can identify important interactions that may be missed when experimenting with one factor at a time.[41]
Tools for implementation and process management
1. Project Management Methods
Six Sigma companies recognize early on the importance of strong project management skills: planning, budgeting, scheduling, communication, and people management. Technical project management tools such as Gantt chart scheduling can be used for implementation and process management.
2. Potential Problem Analysis (PPA) and Failure Mode and Effects Analysis (FMEA)
PPA is a systematic method for determining what could go wrong in a plan under development. The problem causes are rated according to their likelihood of occurrence and the severity of their consequences. Preventive actions are taken, and contingency plans are developed. The process helps to create a smooth, streamlined implementation process.[42]
Similarly, FMEA is a step-by-step approach for identifying all possible failures in a design, a manufacturing or assembly process, or a product or service. It is a common process analysis tool. FMEA begins during the earliest conceptual stages of design and continues throughout the life of the product or service.[43]
3. Stakeholder Analysis
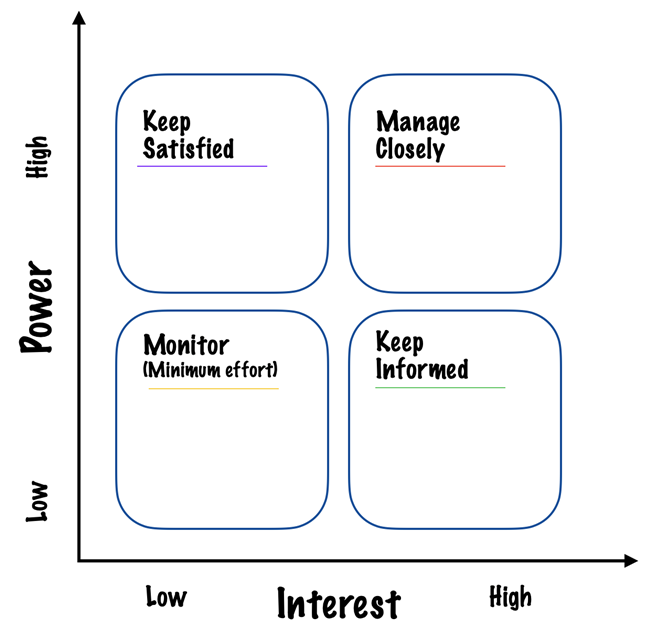
Complex change can affect a lot of people. Six Sigma teams recognize that for change to be successful, it is important to consider the needs and perspectives of various parties involved, i.e. the stakeholders.
The Stakeholder Analysis[44] process is used to determine who the stakeholders are, what are their wants, goals, and concerns and how best to understand mutual interests.
Stakeholders are grouped based on their interest in the project outcome and the power they hold in influencing the change. They usually fall under four categories, each of which needs a different approach to drive successful change:
4. Force Field Diagram
A Force Field Diagram is a result of a force field analysis that shows the relationship between factors that help promote a change vs. those that oppose or create resistance. Like stakeholder analysis, the force field is used to develop plans to build support for a critical change.
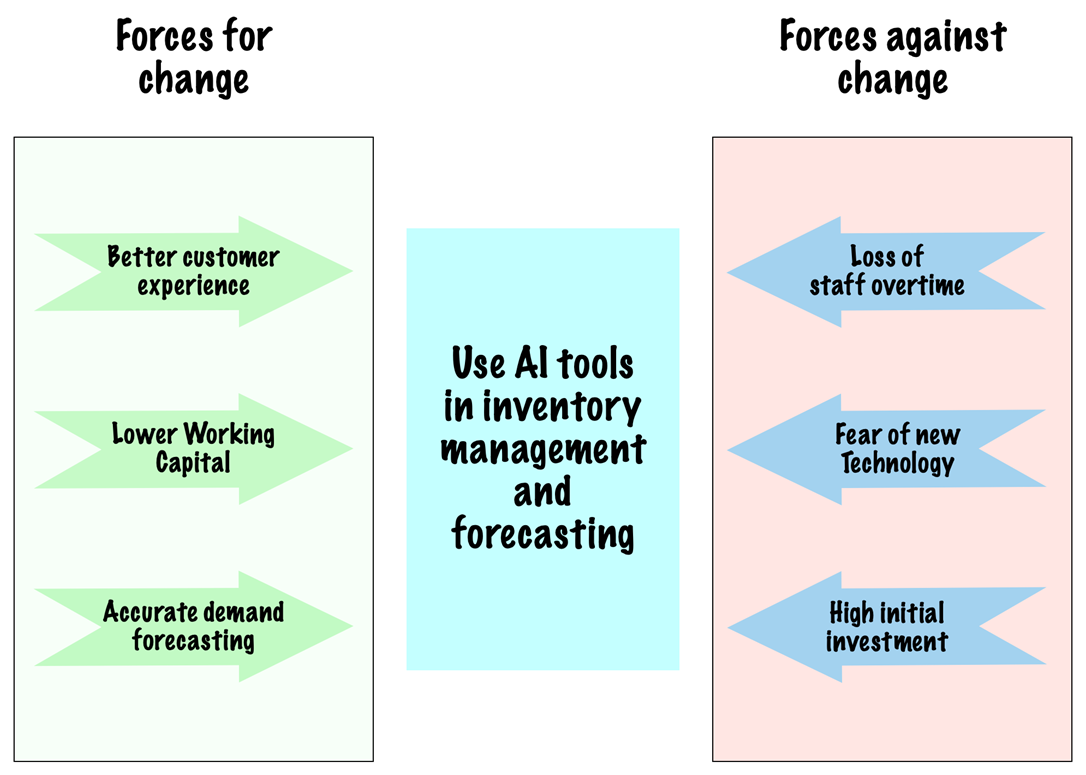
A force field diagram helps the team to focus on improving the driving forces and weakening the resisting forces through education or refinements.
5. Balanced Scorecards
The balanced scorecard[45] is a strategic management tool that views the organization from different perspectives, usually the following:
- Financial: The perspective of shareholders
- Customer: How customers experience and perceive an organization
- Business process: Key processes used to meet and exceed customer/shareholder needs
- Learning and growth: How to foster ongoing change and continuous improvement
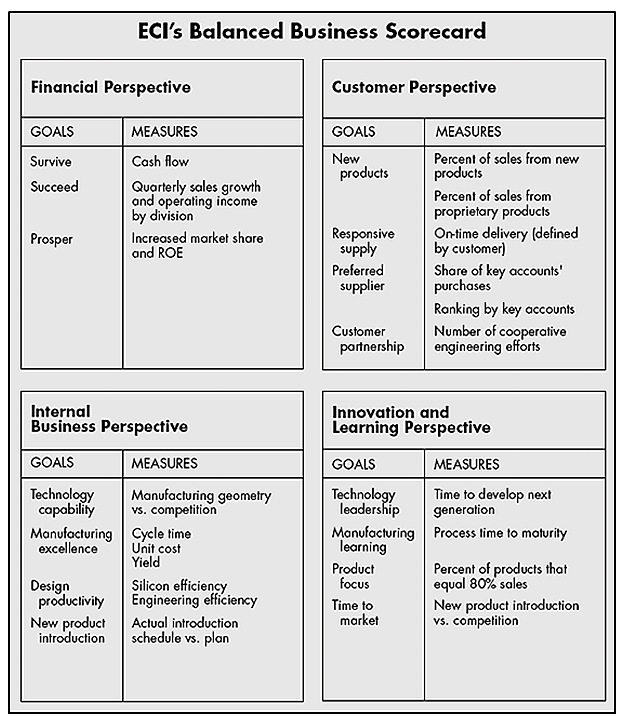
A balanced scorecard provides feedback on both internal business processes and external outcomes to continuously improve strategic performance and results.
6. Solution Selection Matrix
A Solution Selection Matrix (SSM), also known as a Decision Matrix or a Criteria Matrix, is a tool used to objectively assess the strengths and weaknesses of each option and determine the best course of action.
SSM consists of a table or a grid of options and criteria. Each criterion represents a specific aspect or attribute that is important in evaluating the options. The evaluator assigns a rating or score to each option for each criterion.
Once the ratings are assigned, they are often weighted (by assigning a numerical value) to indicate the relative importance. A weighted score is then calculated for each option by multiplying the rating by the corresponding weight.
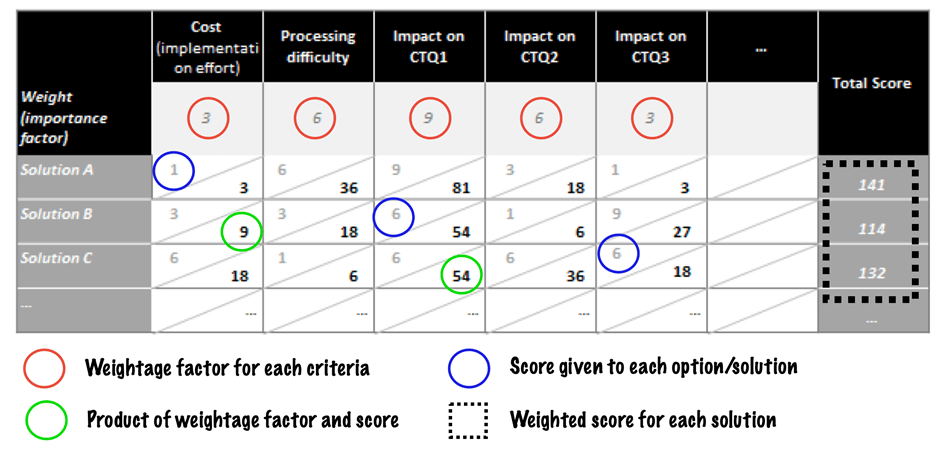
The option with the highest overall score indicates the most favorable choice. SSM provides a structured and systematic approach to decision-making, helping to eliminate bias and subjectivity.
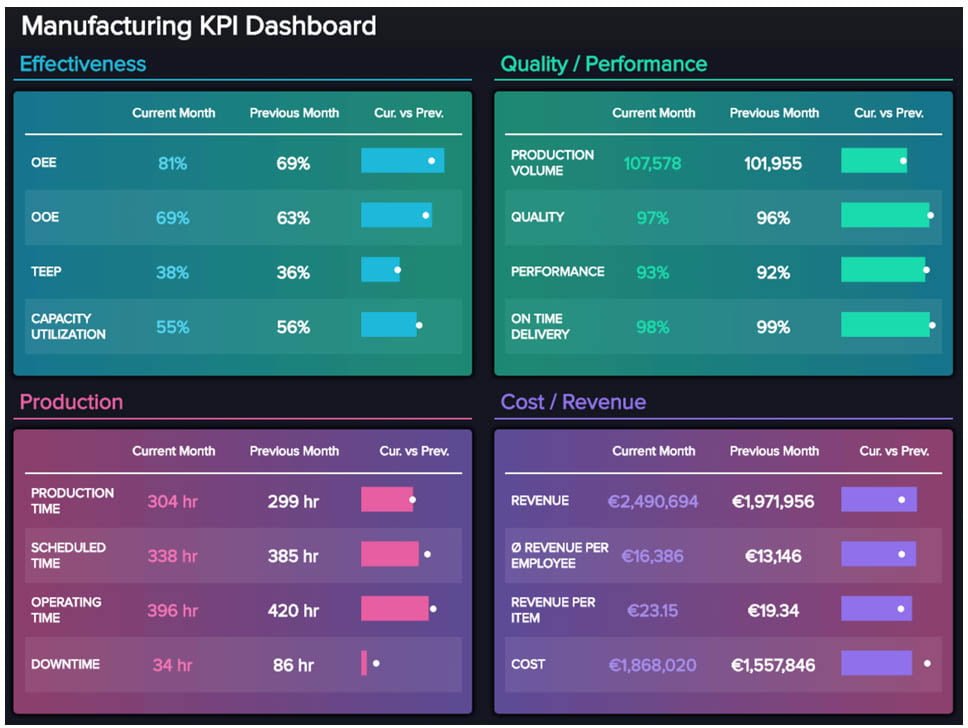
7. Process Dashboards
A Process Dashboard is a vital decision management tool that showcases essential information about process performance to process participants and owners. It provides high-maturity, metrics-intensive data necessary for process analysis and decision-making.
8. Process Documentation
As a DMAIC project reaches a conclusion with solutions in place and results in hand, the Six Sigma team must turn over responsibility to those who will manage the process on an ongoing basis.
Creating effective, clear, not overly complex process documentation that includes process maps, task instructions, measures, and more is the last and most important element of the DMAIC Control step.
Note on Six Sigma tools
While Six Sigma is rich with tools that help make better decisions, solve problems, and manage change, Six Sigma and the tools are one and the same.
Using too many tools can complicate things. Demanding that they be used when they aren’t helpful can undermine the goals of Six Sigma just as easily as not using tools.
The following are important considerations when selecting a Six Sigma tool:
- Use only the tools that help in getting the job done.
- Keep it as simple as possible.
- When a tool isn’t helping, stop and try something else.
Six Sigma breakthrough equation
Six Sigma looks at every process through what is known as the breakthrough equation shown below:
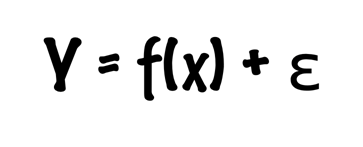
- Y is the outcome(s) or result(s) desired or needed.
- X represents the inputs, factors, or pieces necessary to create the outcome(s). There can be more than one Xs.
- ƒ is the function, the way or process by which the inputs are transformed into the outcome.
- ε (epsilon) is the presence of error or uncertainty surrounding how accurately the Xs are transformed to create the outcome.
In any process, a set of input variables are transformed by a function (or process) and combined with error to form the output. The Y results from, or is a function of, the Xs.
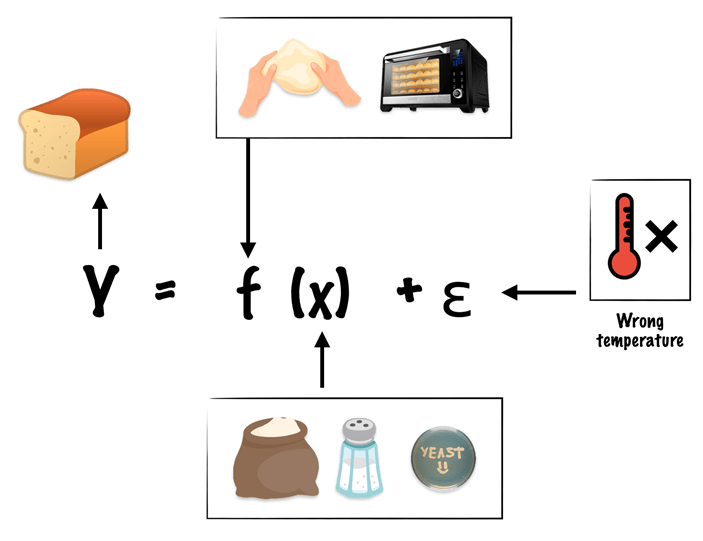
In the bread-making example above, bread is the Y (output). Inputs like the dough, salt, yeast etc., are the Xs while the process of dough making and baking are the ƒ. Errors like wrong temperature leading to improper baking represent the epsilon (ε).
Basic Metrics in Six Sigma
When applying Six Sigma to processes and improvements, the below metrics are used to access and measure process accuracy levels:
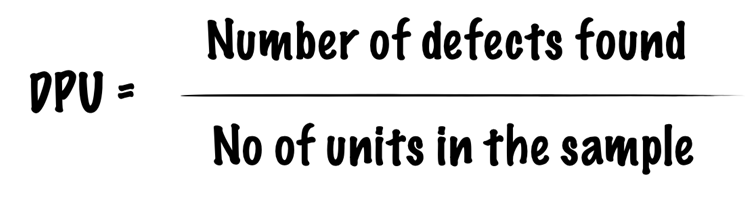
Defects Per Unit (DPU)
DPU is a measure of how many defects there are in relation to the number of units tested.
It is concerned with total defects, and one unit could have more than one defect.
For example, if a publisher printed 1,000 books and pulled out 50 books for quality checks,
that revealed:
- 3 books are missing pages
- 1 book is missing pages and has a torn cover
- 2 books have loose spines
- 1 book has incorrect printing and incorrect alignment
There are 9 total errors in a sample size of 50 books, hence the DPU is calculated as:
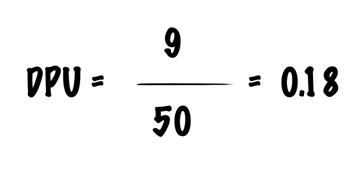
DPU provides an average level of quality. It tells how many defects on average each unit can be expected to have. In this case, that is 0.18 defects on average.
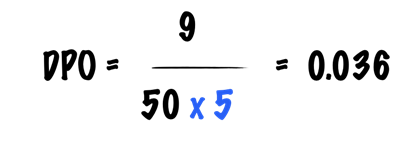
Defects per Opportunity (DPO)
DPO is the number of defects in a sample divided by the total number of defect opportunities.
In the above example, each book has a possibility of 5 types of errors (missing page, torn cover, loose spine, incorrect printing, and incorrect alignment). Hence the opportunity for error in each book is 5 and DPO is calculated as:
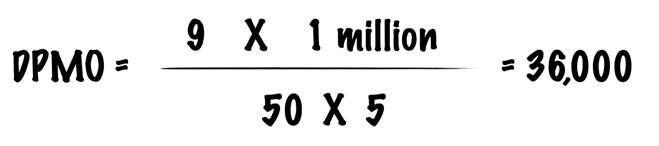
Defects per Million Opportunities (DPMO)
This represents a ratio of the number of defects in one million opportunities. In other words, how many times did a flaw or mistake (defect) occur for every million opportunities there were to have a flaw or a mistake?
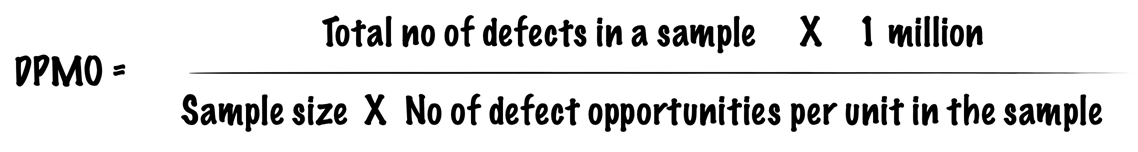
DPMO is also the same as DPO multiplied by a million. By scaling the sample size to a common value (1 million), DPMO allows to compare accuracy levels of different processes.
In the book example, DPMO is calculated as:
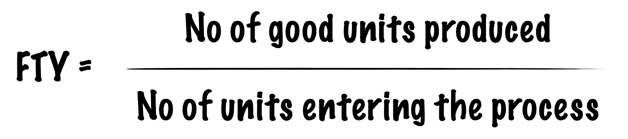
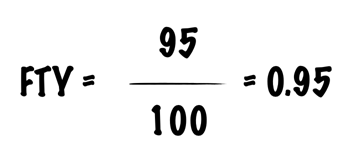
First-Time Yield (FTY)
FTY is the ratio of units produced to units attempted to produce.
For example, if 100 cookies were put in the oven, but only 95 came out edible, then:
Most products or services are created via multiple processes, in which case FTY for each process needs to be multiplied to calculate an overall FTY.
Rolled Throughput Yield (RTY)
RTY provides a probability that a unit will be generated by a process with no defects.
One of the main differences between RTY and FTY is that RTY considers whether rework was needed to generate the number of final units. This is valuable as organizations don’t always think about the rework that is inherent in a process, which means they often measure a process and deem it successful even if waste is present.
Consider the following process chain:
| Process | Units Entered | Units Scrapped | Units Reworked | Units Produced |
|---|---|---|---|---|
| A | 100 | 5 | 5 | 95 |
| B | 95 | 10 | 5 | 85 |
| C | 85 | 5 | 15 | 80 |
The RTY is calculated as follows:
RTY for Process A: 100 – (5 + 5) = 90, 90/100 = 0.9
RTY for Process B: 95 – (10 + 5) = 80, 80/95 = 0.84
RTY for Process C: 85 – (5 + 15) = 65, 65/85 = 0.76
Overall RTY = 0.9 * 0.84 * 0.76 = 0.574
While RTY does not indicate final production or sales, a low RTY indicates that there is waste in the process in the form of rework.
Six Sigma vs. Lean Six Sigma
While Six Sigma focuses on eliminating defects and reducing variation, Lean Six Sigma (LSS) focuses on eliminating waste and improving speed. LSS combines Lean Management and Six Sigma to increase the velocity of value creation.
During the 2000s, Lean Six Sigma forked from Six Sigma and became its own unique process. LSS developed as a specific process of Six Sigma, incorporating ideas from lean manufacturing, which was developed as a part of the Toyota Production System in the 1950s.
Lean Six Sigma is more specifically used to streamline manufacturing and production processes, while Six Sigma methodologies can benefit any business.
![A comparison between Six Sigma and Lean Six Sigma (Source: Amile Institute[50])](https://strategicmanagementinsight.com/wp-content/uploads/six-sigma-lean-six-sigma.png)
Six Sigma Training Levels and Roles
Possessing a Six Sigma certification proves that an individual has demonstrated practical applications and knowledge of Six Sigma. These certification levels are differentiated by belt level.
The belt color someone holds will help to determine what role they will play in a given project and how they will be spending their time. Broadly they are shown as below:
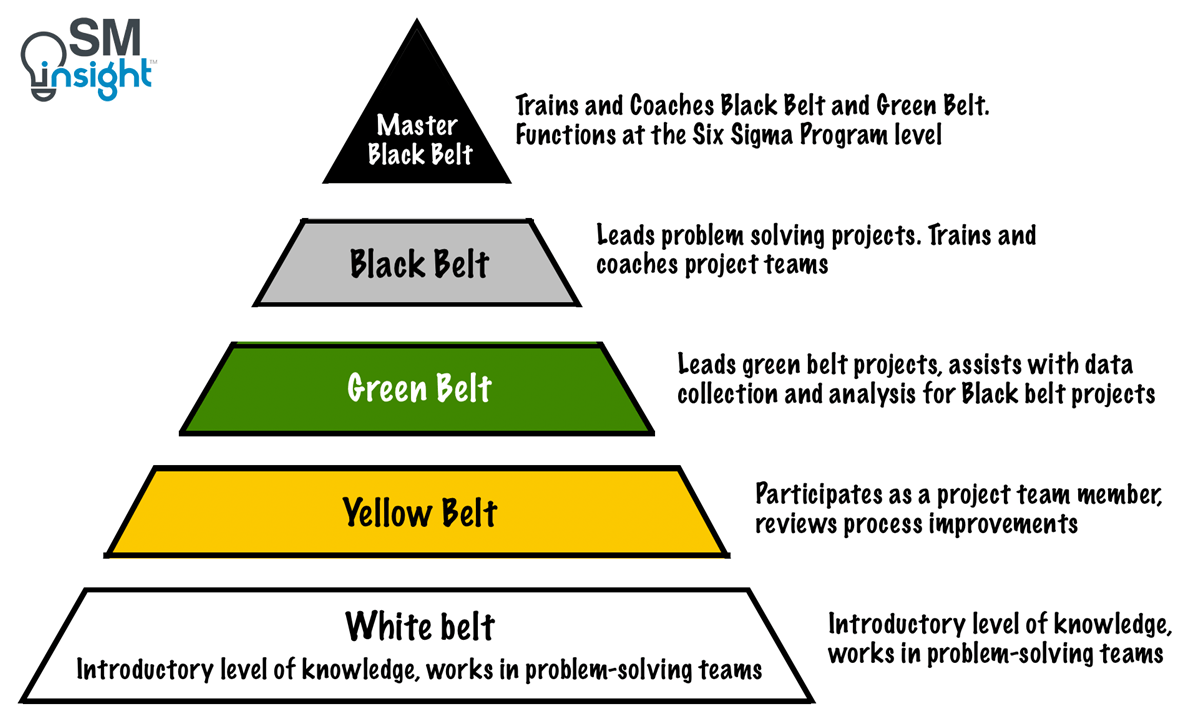
In addition to the above levels, there is Six Sigma Champion which is not a belt per se but plays a crucial role in Six Sigma projects and organizations.
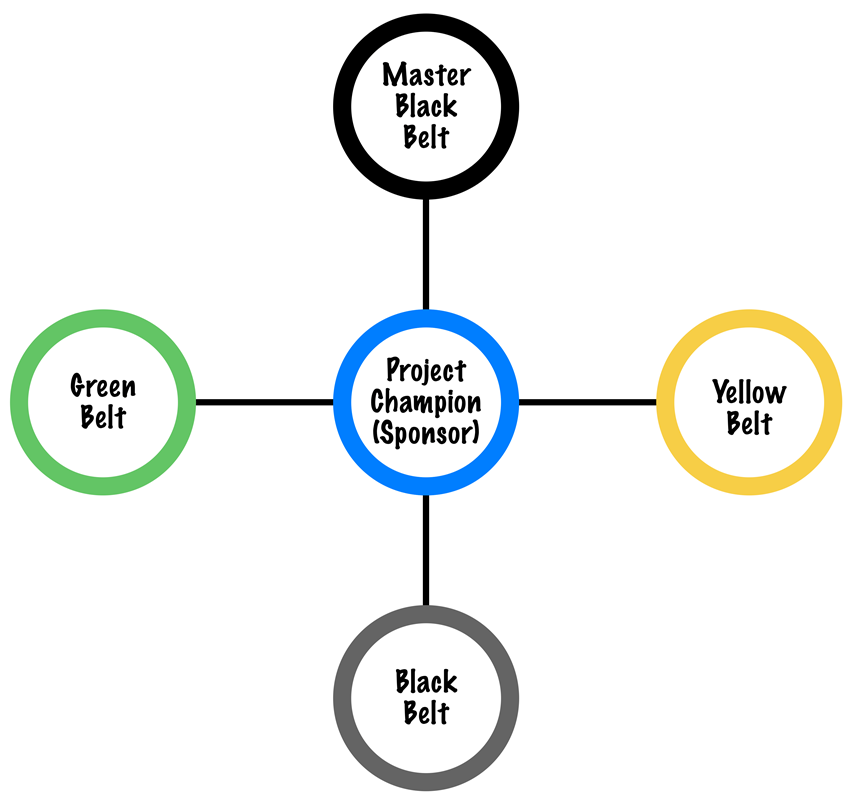
The primary function of the Champion is to ensure that all operational projects align with strategic business objectives.
Sources
1. “Six SIGMA: A Complete Step-By-Step Guide: A Complete Training & Reference Guide for White Belts, Yellow Belts, Green Belts, and Black Belts”. Six Sigma Council, https://www.sixsigmacouncil.org/wp-content/uploads/2018/08/Six-Sigma-A-Complete-Step-by-Step-Guide.pdf. Accessed 06 Jul 2023
2. “Air Traffic By The Numbers”. Fedaral Avaiation Administration, https://www.faa.gov/air_traffic/by_the_numbers. Accessed 06 Jul 2023
3. “How many Amazon packages get delivered each year?”. The Conversation, https://theconversation.com/how-many-amazon-packages-get-delivered-each-year-187587. Accessed 06 Jul 2023
4. “Carl Friedrich Gauss”. Wikipedia, https://en.wikipedia.org/wiki/Carl_Friedrich_Gauss. Accessed 06 Jul 2023
5. “Walter A Shewhart”. Sixsigmastudyguide, https://sixsigmastudyguide.com/shewhart/. Accessed 06 Jul 2023
6. “Edwards Deming”. Wikipedia, https://en.wikipedia.org/wiki/W._Edwards_Deming. Accessed 08 Jul 2023
7. “Bill Smith”. Wikipedia, https://en.wikipedia.org/wiki/Bill_Smith_(Motorola_engineer). Accessed 08 Jul 2023
8. “Mikel Harry”. Wikipedia, https://en.wikipedia.org/wiki/Mikel_Harry. Accessed 08 Jul 2023
9. “Trademark Status & Document Retrieval (TSDR)”. The United States Patent and Trademark Office (USPTO), https://tsdr.uspto.gov/#caseNumber=1647704&caseSearchType=US_APPLICATION&caseType=SERIAL_NO&searchType=statusSearch. Accessed 08 Jul 2023
10. “SIX SIGMA – Trademark Details”. Justia, https://trademarks.justia.com/741/99/six-74199225.html. Accessed 08 Jul 2023
11. “The History of Six Sigma”. Isixsigma, https://www.isixsigma.com/history/history-six-sigma/. Accessed 08 Jul 2023
12. “Six Sigma Case Study: General Electric”. 6sigma, https://www.6sigma.us/ge/six-sigma-case-study-general-electric/. Accessed 08 Jul 2023
13. “What Is Six Sigma?”. Peter S. Pande, Lawrence Holpp, https://books.google.co.in/books/about/What_Is_Six_Sigma.html?id=vBzaUJuH8hYC&redir_esc=y. Accessed 10 Sep 2023
14. “BRAINSTORMING”. American Society for Quality, https://asq.org/quality-resources/brainstorming. Accessed 08 Jul 2023
15. “WHAT IS AN AFFINITY DIAGRAM?”. American Society for Quality, https://asq.org/quality-resources/affinity. Accessed 08 Jul 2023
16. “WHAT IS MULTIVOTING?”. American Society for Quality, https://asq.org/quality-resources/multivoting. Accessed 08 Jul 2023
17. “WHAT IS A TREE DIAGRAM?”. American Society for Quality, https://asq.org/quality-resources/tree-diagram. Accessed 08 Jul 2023
18. “Tree Diagram: All you need to know about it”. Qidemy, https://qidemy.com/tree-diagram-all-you-need-to-know-about-it/. Accessed 08 Jul 2023
19. “What is a SIPOC diagram? 7 steps to map and understand business processes”. Asana, https://asana.com/resources/sipoc-diagram. Accessed 08 Jul 2023
20. “SIPOC”. Wikipedia, https://en.wikipedia.org/wiki/SIPOC. Accessed 08 Jul 2023
21. “SIPOC+CM DIAGRAM”. American Society for Quality, https://asq.org/quality-resources/sipoc. Accessed 08 Jul 2023
22. “WHAT IS A FLOWCHART?”. American Society for Quality, https://asq.org/quality-resources/flowchart. Accessed 08 Jul 2023
23. “Comparison of Business Process Model and Notation modeling tools”. Wikipedia, https://en.wikipedia.org/wiki/Comparison_of_Business_Process_Model_and_Notation_modeling_tools. Accessed 08 Jul 2023
24. “Flowchart”. Wikipedia, https://en.wikipedia.org/wiki/Flowchart. Accessed 09 Jul 2023
25. “FISHBONE DIAGRAM”. American Society for Quality, https://asq.org/quality-resources/fishbone. Accessed 09 Jul 2023
26. “Ishikawa diagram”. Wikipedia, https://en.wikipedia.org/wiki/Ishikawa_diagram. Accessed 09 Jul 2023
27. “Critical to Quality Tree (CTQ)”. Minnesota Department of Health, https://www.health.state.mn.us/communities/practice/resources/phqitoolbox/ctqtree.html. Accessed 10 Jul 2023
28. “WHAT IS SAMPLING?”. American Society for Quality, https://asq.org/quality-resources/sampling. Accessed 11 Jul 2023
29. “Randomization: Key to Reducing Bias and Increasing Accuracy”. Isixsigma, https://www.isixsigma.com/dictionary/randomization/. Accessed 09 Jul 2023
30. “Operational Definition”. Isixsigma, https://www.isixsigma.com/dictionary/operational-definition/. Accessed 09 Jul 2023
31. “How to Use Voice of the Customer to Improve Customer Experience”. Isixsigma, https://www.isixsigma.com/dictionary/voice-of-the-customer-voc/. Accessed 09 Jul 2023
32. “WHAT IS STRATIFICATION?”. American Society for Quality, https://asq.org/quality-resources/stratification. Accessed 09 Jul 2023
33. “CHECK SHEET”. American Society for Quality, https://asq.org/quality-resources/check-sheet. Accessed 11 Jul 2023
34. “Measurement System Analysis (MSA)”. Lean6sigmapro, https://www.lean6sigmapro.com/knowledgebase/msa. Accessed 09 Jul 2023
35. “Distinguishing Between Random and Fixed: Variables, Effects, and Coefficients”. Portland State University, https://web.pdx.edu/~newsomj/mlrclass/ho_randfixd.pdf. Accessed 09 Jul 2023
36. “ANOVA gauge R&R”. Wikipedia, https://en.wikipedia.org/wiki/ANOVA_gauge_R%26R. Accessed 09 Jul 2023
37. “Control Chart”. Project Management Research Institute, https://pmri.in/dictionary/control-chart/. Accessed 10 Jul 2023
38. “Data Demystified: Correlation vs. Causation”. Datacamp, https://www.datacamp.com/blog/data-demystified-correlation-vs-causation. Accessed 09 Jul 2023
39. “Tests of Statistical Significance”. California State University, Long Beach, https://home.csulb.edu/~msaintg/ppa696/696stsig.htm. Accessed 09 Jul 2023
40. “Statistics review 7: Correlation and regression”. National Library of Medicine , https://www.ncbi.nlm.nih.gov/pmc/articles/PMC374386/. Accessed 09 Jul 2023
41. “WHAT IS DESIGN OF EXPERIMENTS (DOE)?”. American Society for Quality, https://asq.org/quality-resources/design-of-experiments. Accessed 09 Jul 2023
42. “Potential Problem Analysis”. Digital Healthcare Research, https://digital.ahrq.gov/health-it-tools-and-resources/evaluation-resources/workflow-assessment-health-it-toolkit/all-workflow-tools/potential-problem-analysis. Accessed 09 Jul 2023
43. “FAILURE MODE AND EFFECTS ANALYSIS (FMEA)”. American Society for Quality, https://asq.org/quality-resources/fmea. Accessed 09 Jul 2023
44. “Stakeholder Analysis Process”. Projectmanagement, https://www.projectmanagement.ie/blog/stakeholder-analysis-process/. Accessed 10 Jul 2023
45. ” The Balanced Score Card”. Shree Phadnis, Master Black Belt at KPMG (India), https://www.symphonytech.com/articles/bscard.htm. Accessed 10 Jul 2023
46. “The Balanced Scorecard—Measures that Drive Performance”. Harvard Business Review, https://hbr.org/1992/01/the-balanced-scorecard-measures-that-drive-performance-2. Accessed 10 Sep 2023
47. “MANUFACTURING DASHBOARD EXAMPLES”. Datapine, https://www.datapine.com/dashboard-examples-and-templates/manufacturing. Accessed 09 Jul 2023
48. “A comparison between Six Sigma and Lean Six Sigma”. Amileinstitute, https://www.amileinstitute.org/blog/a-comparison-between-six-sigma-and-lean-six-sigma/. Accessed 10 Jul 2023
49. “What are the Levels (Belts) of Lean Six Sigma Certification?”. Dcmlearning, https://dcmlearning.ie/lean-resources/different-levels-belts-of-lean-six-sigma-certification.html. Accessed 11 Jul 2023