The complexity of managing an organization requires that managers be able to view performance in several areas simultaneously.
Akin to a cockpit in a jet plane, executives need a full battery of instrumentation to guide their companies and monitor the journey toward excellent future outcomes.
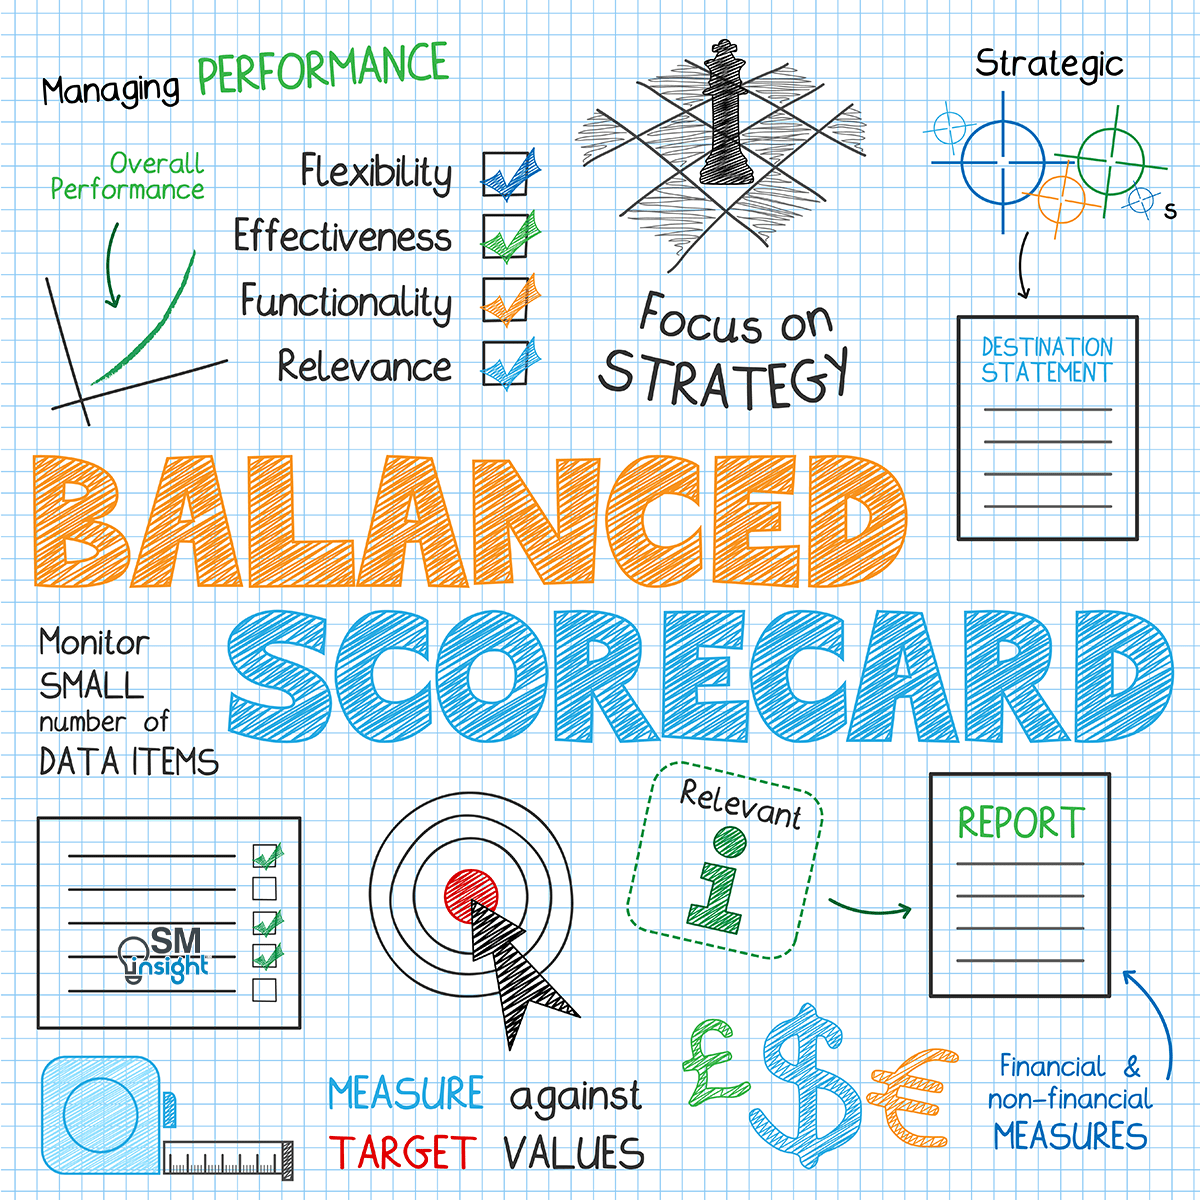
What is a Balanced Scorecard
The Balanced Scorecard (BSC) provides managers with the instrumentation they need to navigate to future competitive success. It translates an organization’s mission and strategy into a comprehensive set of performance measures that provides the framework for strategic measurement and management.
Accounting academic Dr. Robert Kaplan and business executive and theorist Dr. David Norton popularized the balanced scorecard following their Harvard Business Review article first published in 1992[1]
Why the Balanced Scorecard is needed
The traditional financial reporting process has remained anchored to an accounting model developed centuries ago and fails to incorporate the valuation of a company’s intangible and intellectual assets.
It focuses on the past and reveals little about future drivers, such as investments in customers, suppliers, employees, processes, technology, and innovation.
Intangible assets such as the capability to produce high-quality products and services, motivated and skilled employees, responsive and predictable internal processes, and satisfied and loyal customers are far more critical to success but often left unmeasured.
The difficulties in placing a reliable financial value on such assets will likely preclude them from ever being recognized in organizational balance sheets.
BSC expands the set of business unit objectives beyond summary financial metrics. It measures how business units create value for current and future customers and how they must enhance internal capabilities and the investment in people, systems, and procedures necessary to improve future performance.
In short, it reveals the value drivers for superior long-term financial and competitive performance.
BSC is primarily a mechanism for businesses to implement strategy. However, it must not be confused as a strategy formulation tool.
The key concept of the balanced scorecard
BSC requires that a company thinks of its mission and strategy from four key perspectives:
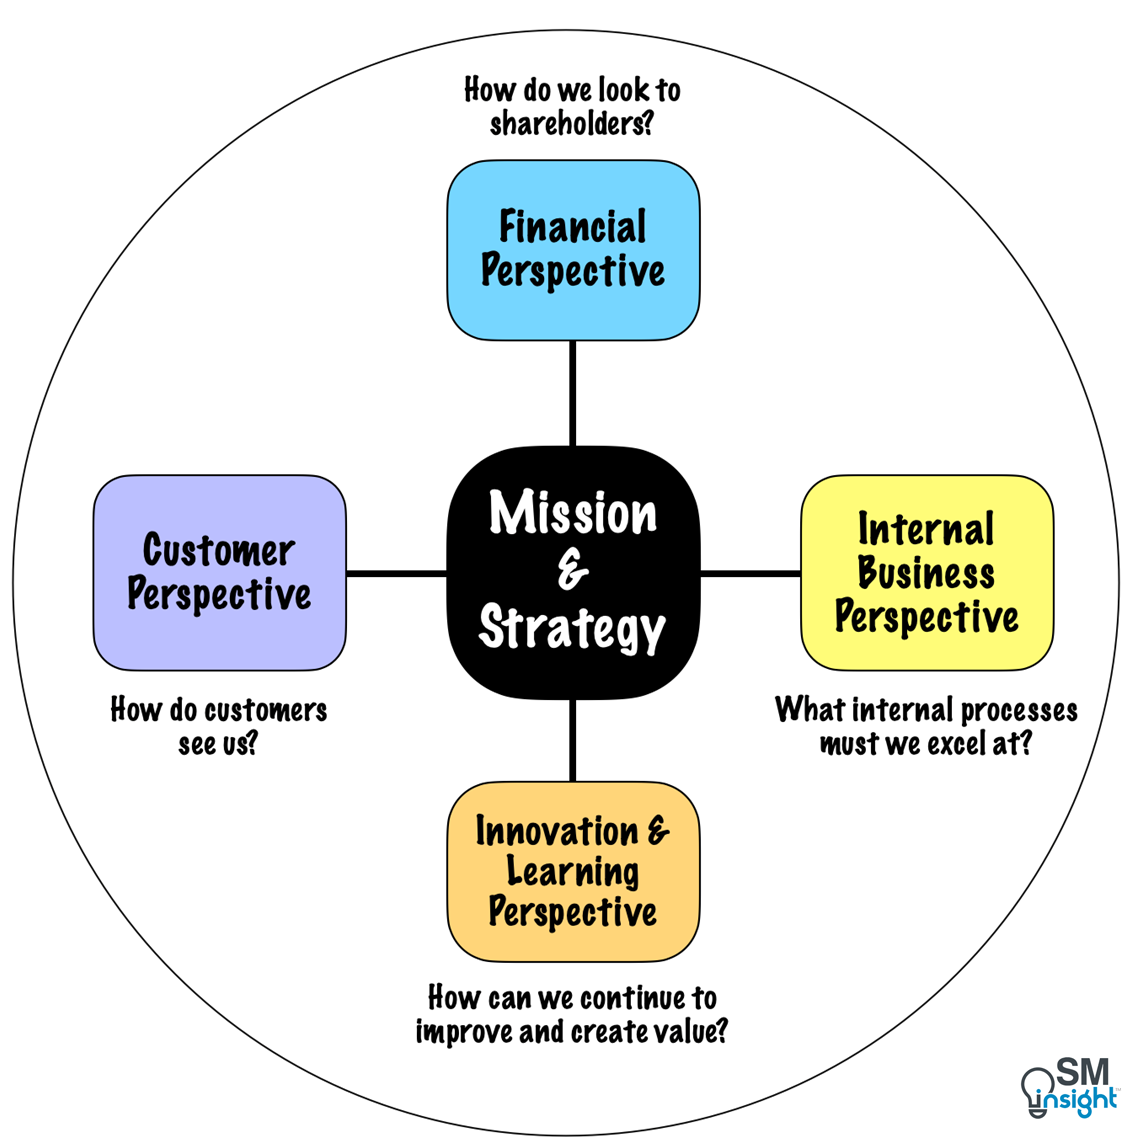
Among these four perspectives, the financial perspective reveals the outcomes of past actions, whereas the remaining three perspectives serve as operational indicators influencing future financial performance.
For example, Return-On-Capital-Employed (ROCE) is a very common scorecard measure from a financial perspective.
Drivers of good ROCE could be repeat sales from existing customers due to a high degree of customer loyalty which is the Customer perspective. Customer loyalty is generally driven by quality and on-time delivery resulting from good internal processes which is the Internal business perspective. Good processes are a result of skilled and motivated employees who are capable of innovation which is the Learning and innovation perspective.
An entire chain of cause-and-effect relationships can be established as a vector through the four BSC perspectives:
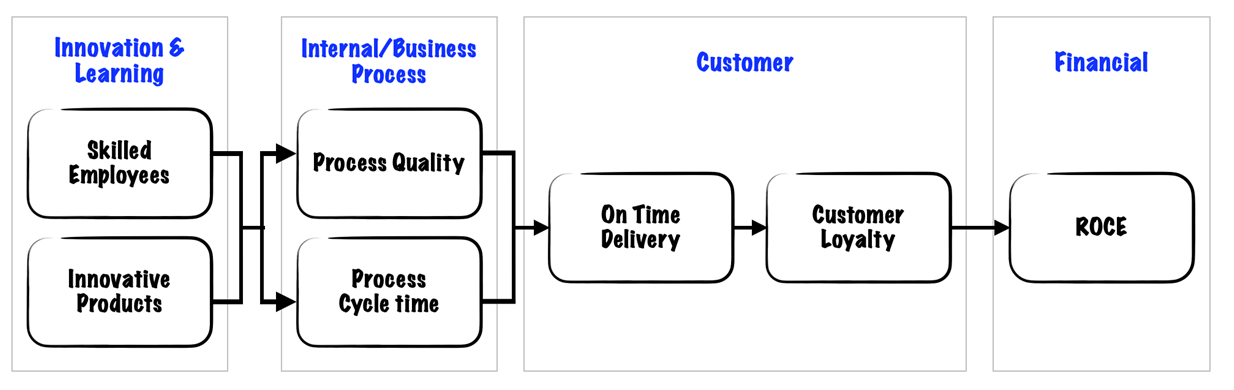
Thus, the causal relationships among employee satisfaction, customer satisfaction, good processes, market share, and eventually, financial performance are addressed by the four perspectives of BSC.
Financial Perspective
Businesses must start developing BSC by linking their financial objectives to corporate strategy. The objectives then play a dual role: they define the financial performance expected from the strategy, and they serve as the ultimate targets for the objectives and measures of all the other scorecard perspectives.
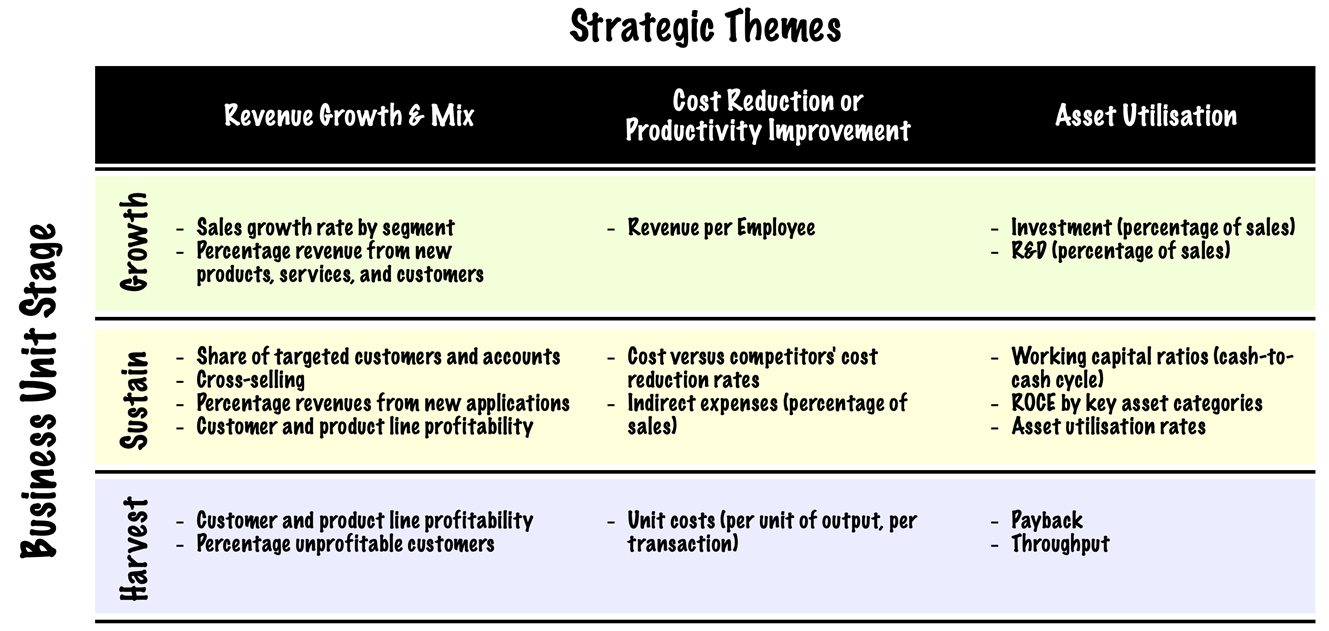
The metrics to be adopted under financial objectives depend on what stage the business is in, and the strategic theme adopted.
The figure below shows the selection of the drivers of aggregate financial objectives as cells in a 3 x 3 matrix across the three business stages (explained below) and the three strategic themes:
Business lifecycle stages
Businesses can adapt different strategies ranging from aggressive market growth to consolidation and exit depending on what stage of lifecycle a business is in. The most common business lifecycles are Growth, Sustain and Harvest. Financial measures to be adopted depend on what stage a business is in.
Growth-stage businesses
These are businesses that are at the early stages of their life cycle and their products or services have significant growth potential.
To capitalize on this potential, they must commit considerable resources and (sometimes) operate with negative cash flows and low short-term returns on invested capital.
Hence, financial objectives for growth-stage businesses must focus on parameters such as the rate of revenue growth and speed of expansion in targeted markets/customer groups/regions.
Sustain-stage businesses
These businesses attract investment and reinvestment but are required to earn excellent returns on invested capital. They are expected to maintain existing market share (and grow it year to year).
Investments in such businesses focus on relieving bottlenecks, expanding capacity, and enhancing continuous improvement.
Financial objectives for such businesses hence focus on profitability – measures such as operating income and gross margin. The goal of the objective is to maximize the income that can be generated from the invested capital.
Harvest-stage businesses
These are businesses that have reached a mature phase of their life cycle where the company wants to harvest the investments made in the two earlier stages.
These businesses no longer need significant investments beyond that needed to maintain equipment and capabilities. They do not look to expand or build new capabilities.
Investment projects in such businesses have very definite and short payback periods where the main goal is to maximize cash flow back to the business.
Financial objectives for harvest-stage businesses could be operating cash flow (before depreciation) and reductions in working capital requirements.
Strategic Themes
For each of the three stages (Growth, Sustain, and Harvest), there are three financial themes that drive the business strategy:
- Revenue growth and mix
- Cost reduction/productivity improvement
- Asset utilization/investment strategy
Revenue growth and mix
Revenue and growth mix covers the expansion of product and service offerings, reaching new customers and markets, changing the product and service mix toward higher-value-added offerings, and repricing products and services.
The most common measures, both for growth and harvest-stage business units are sales growth rates and market share for targeted regions, markets, and customers.
Depending on a business’s area of emphasis, commonly used metrics to monitor revenue growth and mix are as shown:
| Emphasis | More suitable for | Actions | Commonly used measures |
|---|---|---|---|
| New Products | Growth stage businesses | Expand existing product lines or offer entirely new products and services. | % Revenue from new products and services in a given period Prices or gross margins from new products and services |
| New Applications | Sustain stage businesses | Grow revenues by finding new applications for existing products | % Sales from new applications |
| New Customers and Markets | Sustain and Harvest stage businesses. | Taking existing products and services to new customers and markets | % Revenues from new customers, market segments, and geographic regions |
| New Relationships | Sustain and Harvest stage businesses. | Leverage synergies between different strategic business units by having them cooperate to develop new products | % revenue generated from cooperative relationships across multiple business units |
| New Product and Service Mix | Growth, Sustain and Harvest stage businesses | Increase revenues by shifting product and service mix. (For example: Area of cost advantage, low competition etc.). Alternatively, de-emphasizing low-price offerings | Sales growth rate in the targeted segments |
| New Pricing Strategy | Harvest stage businesses | Raising prices of products, services, and customers where revenues are not covering costs (Especially for specialized, niche products or demanding customers) | Profitability by product, service, or customer. Alternatively, For highly homogeneous products and services net revenue per ton, price per call, or price per unit can be used |
Cost reduction/productivity improvement
Cost reduction and productivity improvements reflect efforts to lower the costs of products and services (direct and indirect costs), and share common resources with other business units.
Like in the case of revenue growth and mix, the choice of measure is influenced by the business’s area of emphasis as shown:
| Emphasis | More suitable for | Actions | Commonly used measures |
|---|---|---|---|
| Increase Revenue Productivity | Growth stage businesses | The primary focus is NOT on cost reduction but on flexibility to customize new products and services as per market/customer feedback. | Revenue per employee – Encourages shifts to higher-value-added products and services |
| Reduce Unit Costs | Sustain Stage Businesses | Achieve competitive cost levels, improve operating margins, and lower indirect/support expenses | Cost per unit (Activity-based costing is better suited for businesses where resources and activities are shared across different departments/functions) |
| Improve Channel Mix | Sustain and Harvest Stage Business | Shift customers and suppliers from high-cost manually processed channels to low-cost electronic channels. | % of business transacted through the identified low-cost channel(s) |
| Reduce Operating Expenses | Sustain and Harvest Stage Business | Lower selling, general, and administrative expenses. (Expenses must not be seen as a burden. They must be carefully balanced with measures like customer responsiveness, quality, and performance so that cost-cutting does not interfere with important customer and process objectives) | Tracking the amount of the identified expense either absolute or in terms of % of revenues. Activity-based costing provides a better way to link expenses with the impact they produce. |
Asset utilization/investment strategy
Businesses must strive toreduce the working capital levels required to support a given volume and mix of business.
One way is to maximize asset utilization by directing resources that are not used to capacity and liquidating assets that provide inadequate returns on their value.
Objectives, such as Return On Investment (ROI), Return On Capital Employed (ROCE), and Economic Value Added (EVA) serve as measures of the success of financial strategies to increase revenues, reduce costs, and increase asset utilization.
Companies may also wish to identify the specific drivers they will use to increase asset intensity, some of which are:
Reducing Cash-to-Cash Cycle
Cash-to-Cash (C2C) Cycle represents the time required for the company to convert cash payments to suppliers of inputs to cash receipts from customers.
It is a measure of the efficiency of working capital management and is calculated as follows:
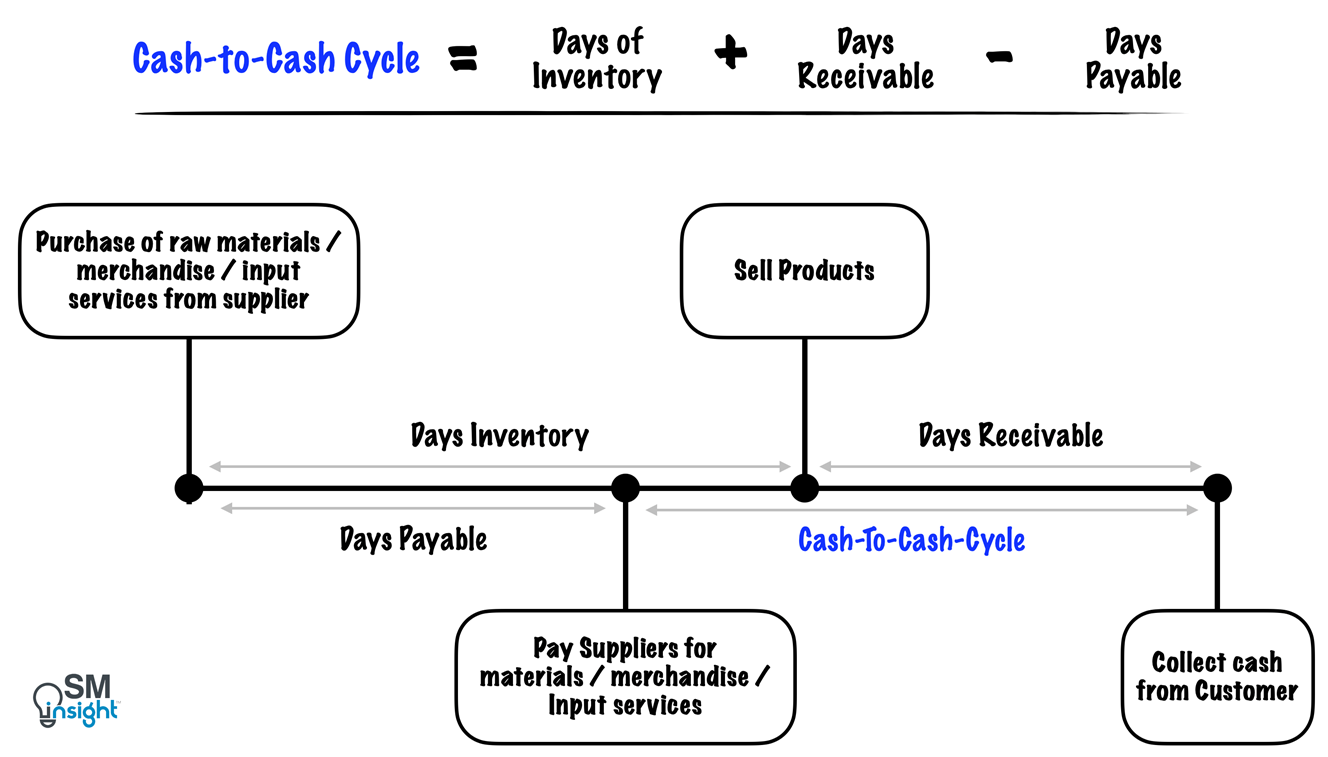
Ideally, companies could even operate with negative C2C cycles by matching inventories extremely closely to final sales, collecting quickly from customers, and negotiating favorable terms with suppliers.
Hence the goal of reducing the C2C from current levels is an excellent target for improving working capital efficiency.
Improving Asset Utilization
Resources that an organization deploys for its operations require considerable capital investments.
These investments include physical capital, such as information systems, specialized equipment, and distribution facilities as well as -intellectual and human capital, such as skilled technologists, databases, and market and customer know-how.
Companies can increase the leverage of such investments by sharing them across multiple business units and exploiting revenue benefits through economies of scale.
Hence a financial objective could include measures to increase the percentage of system resources that are shared with other business units, particularly scarce and expensive resources.
Role of risk management in financial objectives
Financial objectives must also balance expected returns with the management and control of risk. This could include diversifying revenue sources away from a narrow set of customers, one or two business lines, or geographical regions.
Risk management should be built into the financial objective as an overlay – an additional objective that compliments the expected return strategy the business has chosen.
Financial objectives in summary
To summarize, financial objectives represent the long-term goal of the organization to provide superior returns based on the capital invested in a business unit.
BSC does not conflict with this vital goal. Indeed, it makes the financial objectives more explicit and customizes the financial objectives to business units in different stages of their growth and life cycle.
It enables executives of business units to specify not only the metric by which the enterprise’s long-term success will be evaluated but also the variables considered most important to create and drive the long-term outcome objectives.
Every measure selected for a scorecard is part of a link of cause-and-effect relationships, ending in financial objectives, that represents a strategic theme for the business unit.
Customer Perspective
The Customer Perspective of BSC enables companies to align their core customer outcomes and measures to targeted customers and market segments.
It enables them to identify and explicitly measure the value propositions they will deliver by translating an organization’s mission and strategy into specific objectives that can be communicated throughout the organization.
Market Segmentation
Companies that try to be everything to everybody usually end up being nothing to anyone. Hence, the first step in developing objectives and measures for a Customer Perspective is to identify market segments in which to compete.
Customers are not homogeneous. They can have different preferences and can value product/service attributes differently. A company’s strategy is thus defined by the customer and market segments it chooses.
The figure below illustrates segmentation in the auto industry. Notice how the customers in each segment value different aspects. Some brands do address more than one segment (e.g., Toyota Corolla is a mass-market product while (Toyota) Lexus caters to the luxury segment).
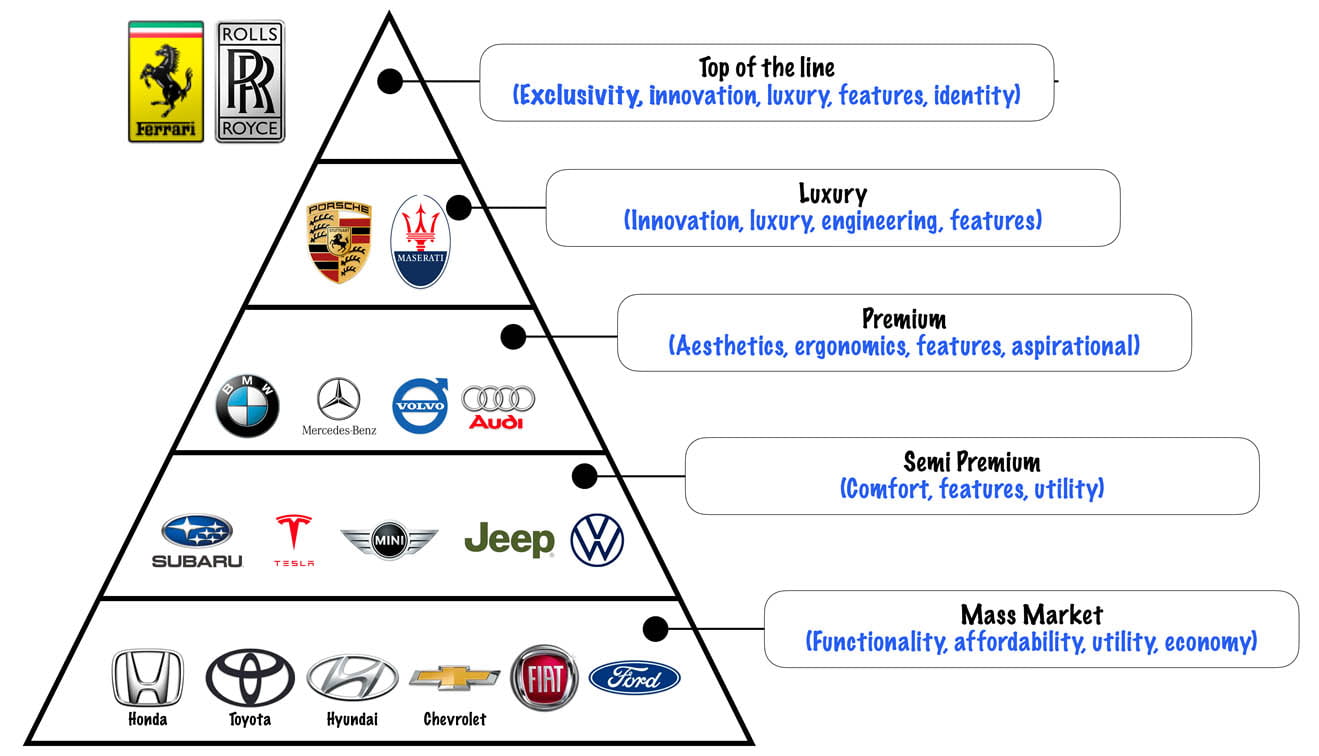
In any industry, no single brand/company can maintain its presence and excel in every segment. At the most, a few segments can be addressed.
Once a business has identified and targeted its market segments, it can address the objectives and measures for its targeted segments. Companies generally select two sets of measures for their customer perspective, as shown:
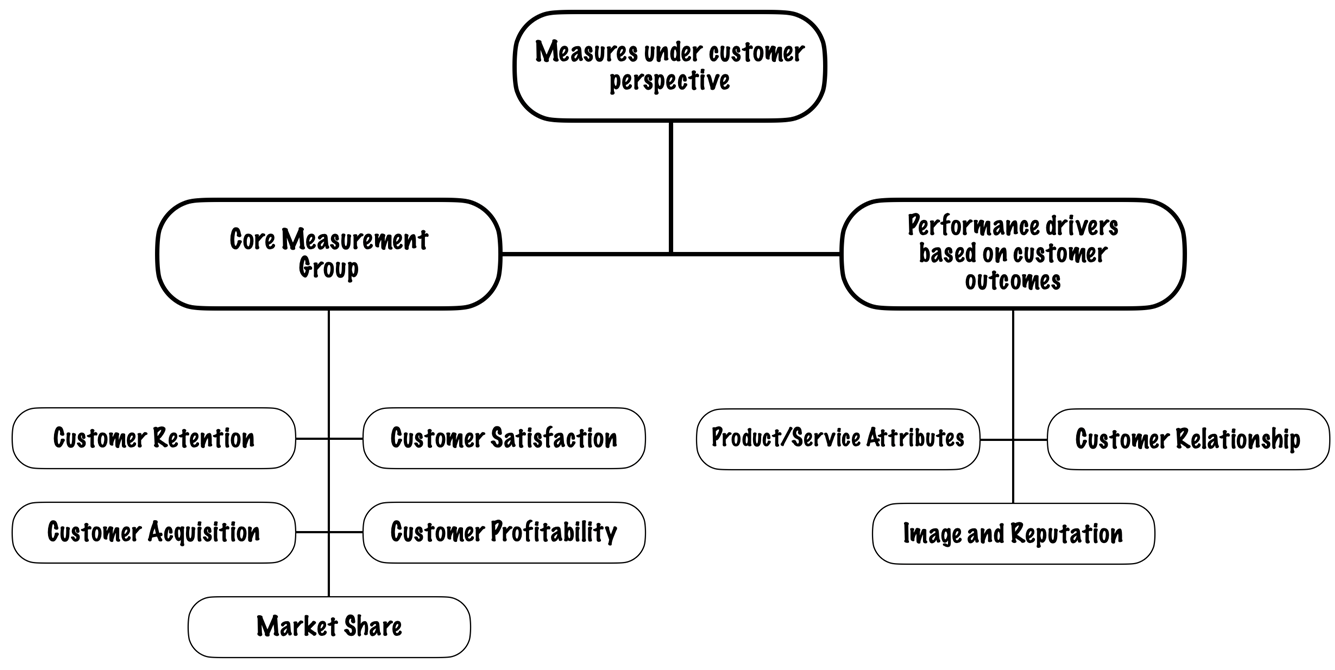
The first set – the “core measurement group” represents generic measures that virtually all companies can use.
The second set of measures – “performance drivers” are more specific differentiators of customer outcomes. They capture the value propositions that the company will attempt to deliver to its targeted customer and market segments.
Core Measurement Group
The five measures of the core measurement group – Market Share, Customer Retention, Customer Acquisition, Customer Satisfaction and Customer profitability can be grouped in a causal chain of relationships as shown:
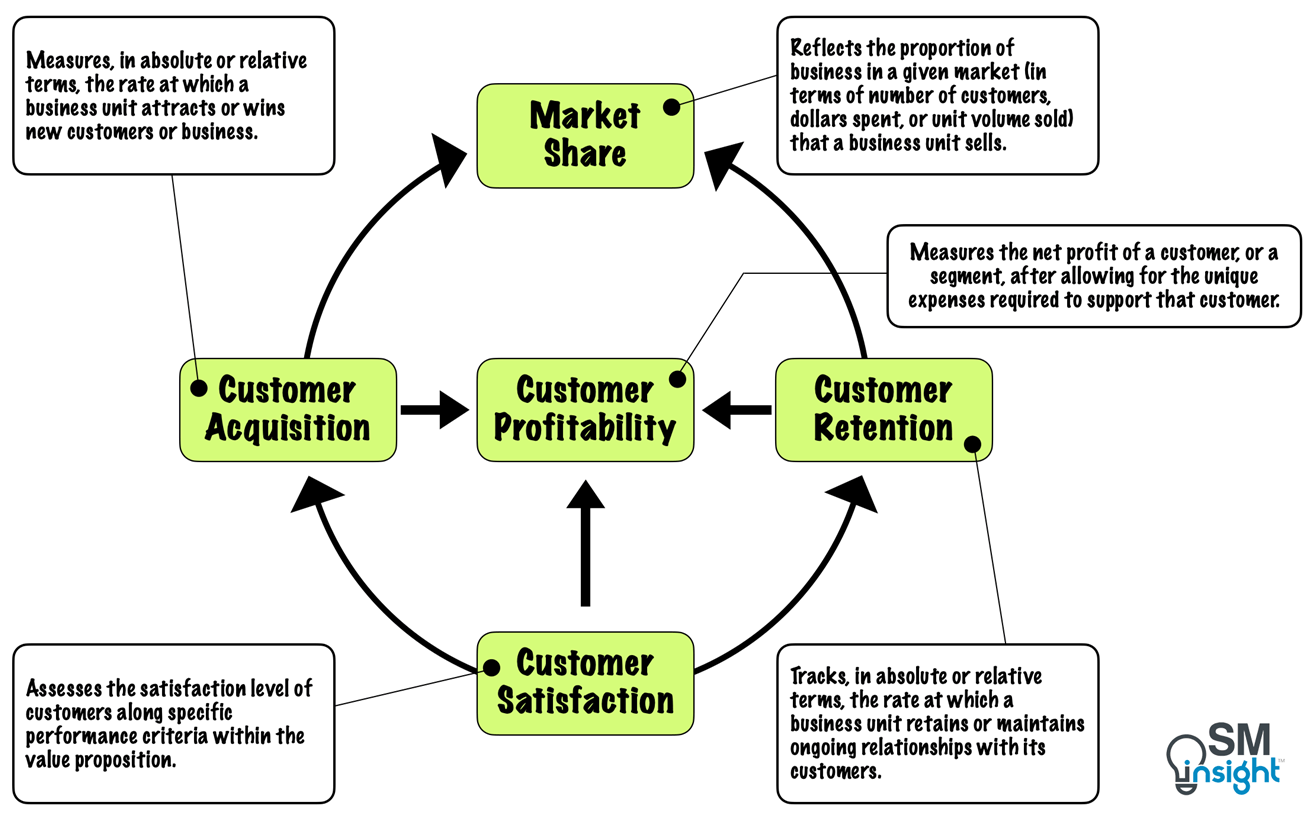
Market Share
Measuring market share becomes straightforward once a specific customer group or market segment has been identified. This clarity helps businesses focus their efforts effectively.
It is important that the chosen market share metric aligns with the company’s strategy. For example, a business with a strategic focus on increasing its share of Tier 1 customers (long-term partners / high-margin customers) must define who the customers are either at an individual level or segment level.
Feedback provided by a well-defined market share metric goes beyond the financial measures and signals whether a company is building value-adding relationships and is implementing its strategy effectively.
Customer retention
It is easier and more profitable to sell to existing customers than to new customers. According to a Harvard study, acquiring a new customer is anywhere from five to 25 times more expensive than retaining an existing one.[3]
Research by Frederick Reichheld of Bain & Company found that increasing customer retention rates by just 5% increases profits by 25% to 95%.[4]
Customer spending tends to accelerate over time. Longer-term customers are also more efficient users of the products and services and have lower operational costs. They provide more referrals and are less price-sensitive.
The overall value of a customer increases the longer that customer remains a customer. Customer retention in a BSC is thus an important measure of customer loyalty.
Customer acquisition
The customer acquisition measure tracks, in absolute or relative terms, the rate at which a business unit attracts or wins new customers or business. It can be measured either by the number of new customers or the total sales to new customers in chosen segments.
Some of the additional metrics that can be measured in a BSC along with customer acquisition measures are:
- Customer acquisition cost (CAC) – Measures the cost incurred by a business to attract and acquire a new customer.
- Customer lifetime value (CLV) – A metric that measures the value of a customer’s relationship with a business.[5]
- Churn Rate – Measures the average number of customers who abandon the products or services.[6]
In addition, online and e-commerce businesses can have additional measures, some of which are the click-through rate (CTR), conversion rate, lead generation rate, and shopping cart abandonment rate.[7]
Customer satisfaction
Customer satisfaction is a measure of how well a business meets its customer’s needs. It drives both, customer retention and customer acquisition.
Companies invest lots of time and money measuring customer satisfaction, but often the yardsticks used are complex, yield ambiguous results, and don’t necessarily correlate to profits or growth.
According to a Harvard study, measuring customer satisfaction boils down to just one question – “How likely is it that a customer would recommend a product(s) or a service(s) to a friend or colleague?”
When customers recommend, they are willing to put their reputations on the line. They take that risk only if they are intensely loyal.
In BSC, companies can use net-promoter score: the ratio of promoters to detractors.
Based on responses on a 0 to 10 rating scale, customers can be grouped into “promoters” (9–10 rating: extremely likely to recommend), “passively satisfied” (7–8 rating), and “detractors” (0–6 rating: extremely unlikely to recommend).
By subtracting the percentage of detractors from the percentage of promoters, the net promotor score can be arrived at.
Companies that garner world-class loyalty have been found to receive net-promoter scores of 75% to more than 80%.[8]
Customer profitability
Companies should want more than satisfied and happy customers; they should want profitable customers.
Not all customer demands can be satisfied in ways that are profitable to an organization. Demanding services sometimes require that a business either declines the opportunity or seeks a price increase that compensates it for the resources deployed.
Thus, a measure like customer profitability helps keep customer-focused organizations from becoming overly customer-obsessed.
In some cases, short-term data may indicate even targeted customers to be unprofitable, particularly when they are newly acquired through considerable acquisition efforts.
In such cases, it is important to consider the profitability of business growth and the lifetime value to better access the opportunity.
A simple way to combine considerations of targeted market segments and customer profitability is as shown:
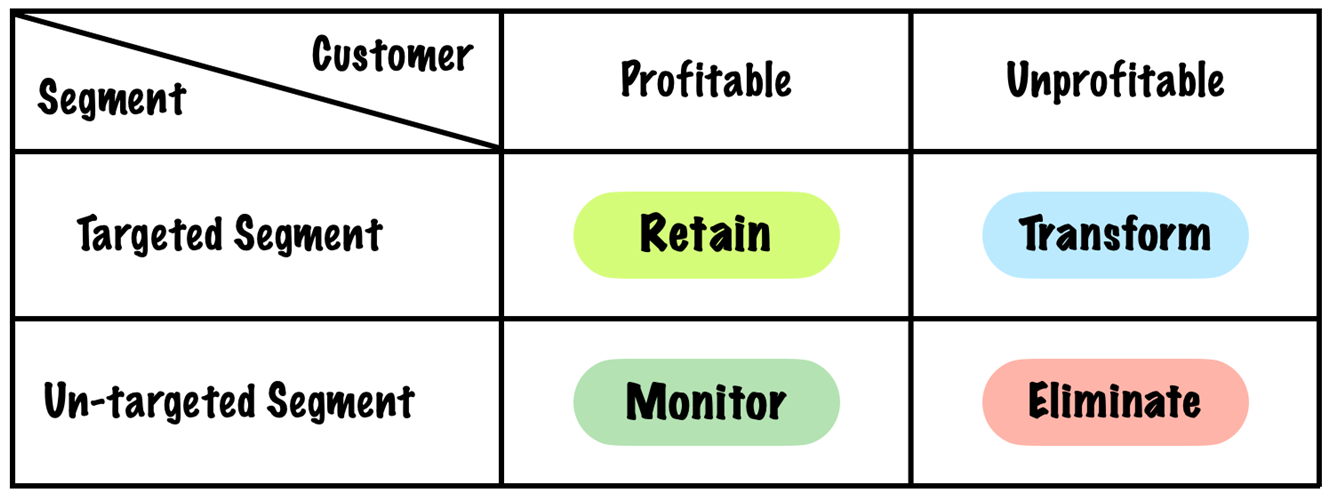
Retain and Eliminate are fairly straightforward – a company certainly wants to retain its profitable customers in targeted segments and should have little future interest in unprofitable customers in untargeted segments.
Unprofitable customers in targeted segments, however, represent opportunities for transformation. Some of them could be newly acquired customers who may need more time to turn profitable. If Longer-standing customers are found to be unprofitable, a repricing of services or products may be needed.
More interesting are profitable customers in untargeted segments which may point to overlooked opportunities or growing potential. They must be monitored to assess new demands for products and services.
Thus, profitability measures provide valuable feedback on the effectiveness of market segmentation strategies.
Performance measures based on customer outcomes
These measures go beyond the scope of the core measurement group and measure Customer Value Propositions (CVP).
CVPs represent the attributes that supplying companies provide through their products and services to create loyalty and satisfaction in targeted customer segments.
CVPs vary across industries and market segments within the industries but can be broadly organized into three categories: Product/service attributes, Customer relationships and Image and reputation.
They come together to generate value as shown:
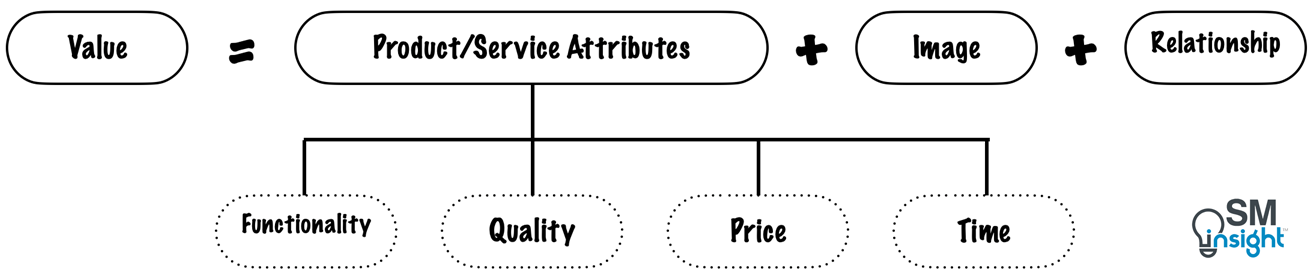
Product/service attributes
These attributes encompass the functionality of the product/service, its price, and its quality and depend on which customer segment a business has chosen to serve.
For example, one customer segment might value a basic product delivered reliably and on time with no defects and at the lowest possible price while another segment may be willing to pay a price premium for features or services that they perceive as important.
Time
The ability to swiftly and reliably respond to customer requests is key to acquiring and retaining valuable customers. Time plays a crucial role in customer value generation.
For example, Hertz allows busy travelers to access their rented car effortlessly with pre-prepared paperwork. Some banks process loans in mere minutes.
Many customers prioritize the reliability of lead times over speed and cost. Shippers, for example, may choose more expensive truck transport over rail due to its dependable arrival times.
Manufacturers such as Honda and Toyota operate with minimal inventory and use the just-in-time system which requires deliveries within a one-hour window. Service companies also depend on timely deliveries for customer satisfaction.
Thus, to deliver customer value, businesses must understand what is important to their customers before choosing a time-measure.
Quality
Over the decades, quality has shifted from being a strategic advantage to a competitive necessity. Businesses must hence monitor trends in quality measures such as returns by customers, warranty claims, and field service requests.
While this is straightforward in a product-based company, in a service company, the customer has nothing to return and usually no one responsive to complain to. This could lead to a decline in business and market share. Often, such a signal is delayed and almost impossible to reverse.
Hence, service companies must offer service guarantees and immediately refund not only the purchase price but also a premium above the purchase. Such guarantees have several benefits:
- It allows it to retain a customer who otherwise might be lost forever
- The organization receives an early signal about the incidence of defective service, enabling it to initiate a program of corrective action
- The knowledge of the existence of the service guarantee provides motivation and incentives for the people delivering customer service to avoid defects that would trigger a request for the guarantee
Price
Irrespective of whether a business unit is following a low-cost or a differentiated strategy, its customers will always be concerned with the price they pay for the product or service.
Hence, price competitiveness is an important part of BSC measures.
In price-sensitive market segments, businesses can track their net selling price with that of competitors. If the product or service is sold through competitive bidding, the percentage of bids won (especially in targeted segments) could provide an indication of price competitiveness.
However, even price-sensitive customers may favor suppliers that offer not low prices but low total costs to acquire and use the product or service.
For example, depending on the miles clocked, the lifetime value of a hybrid car could be higher than a traditional gasoline car despite its higher initial purchase price.
A BSC measure of price competitiveness must thus extend beyond the immediate selling and consider how customers see value.
Image and reputation
These dimensions reflect the intangible factors that attract a customer to a company. They can be influenced by advertising and brand messaging.
Consumer preferences for certain brands (e.g., Nike for athletic shoes and Louis Vuitton for designer clothing) connote the power of image and reputation. Companies with good image and reputation enjoy the power to proactively define themselves in the eyes of their customers.
For example, through the “Move to Zero initiative”, Nike is signaling its move towards zero carbon and zero waste. In the eyes of many, it is seen as an environmentally responsible brand that positively impacts its sales.[9], [10]
Prior to selecting measures related to image and reputation, a business must have a clear image of who its targeted customers are. This can be achieved by developing a customer persona.
The example below shows the customer persona defined by Lululemon Athletica – a leading athleisure brand:
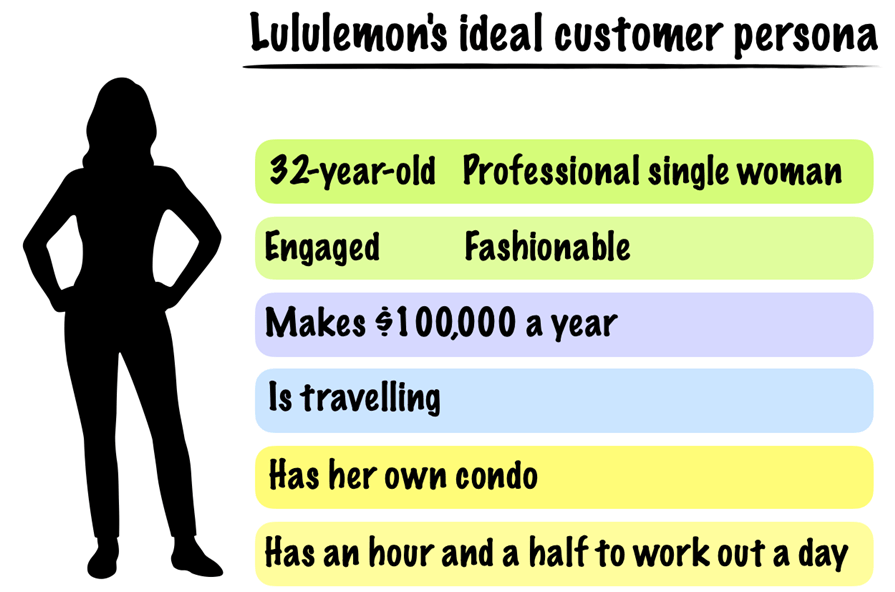
Having developed the persona, it becomes easier to communicate with the targeted customer and convey the desired image externally thus influencing buying behaviors.
Customer Relationship
Customer relationship is about how the customer feels about purchasing from a company. This is influenced by factors such as how knowledgeable and capable its employees are in recognizing customer needs and providing solutions, their accessibility and responsiveness.
Good customer relationship enables a business to command premium pricing for its products and services.
Internal business process perspective
The Internal business process perspective focuses on the processes most critical to achieving the customers’ needs. The BSC approach suggests defining a comprehensive internal-process value chain, starting with innovation, operation, and post-sale service:
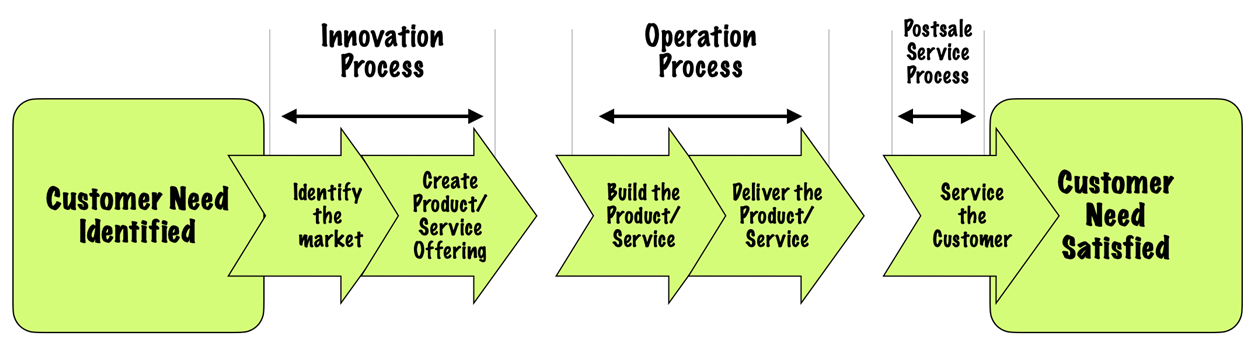
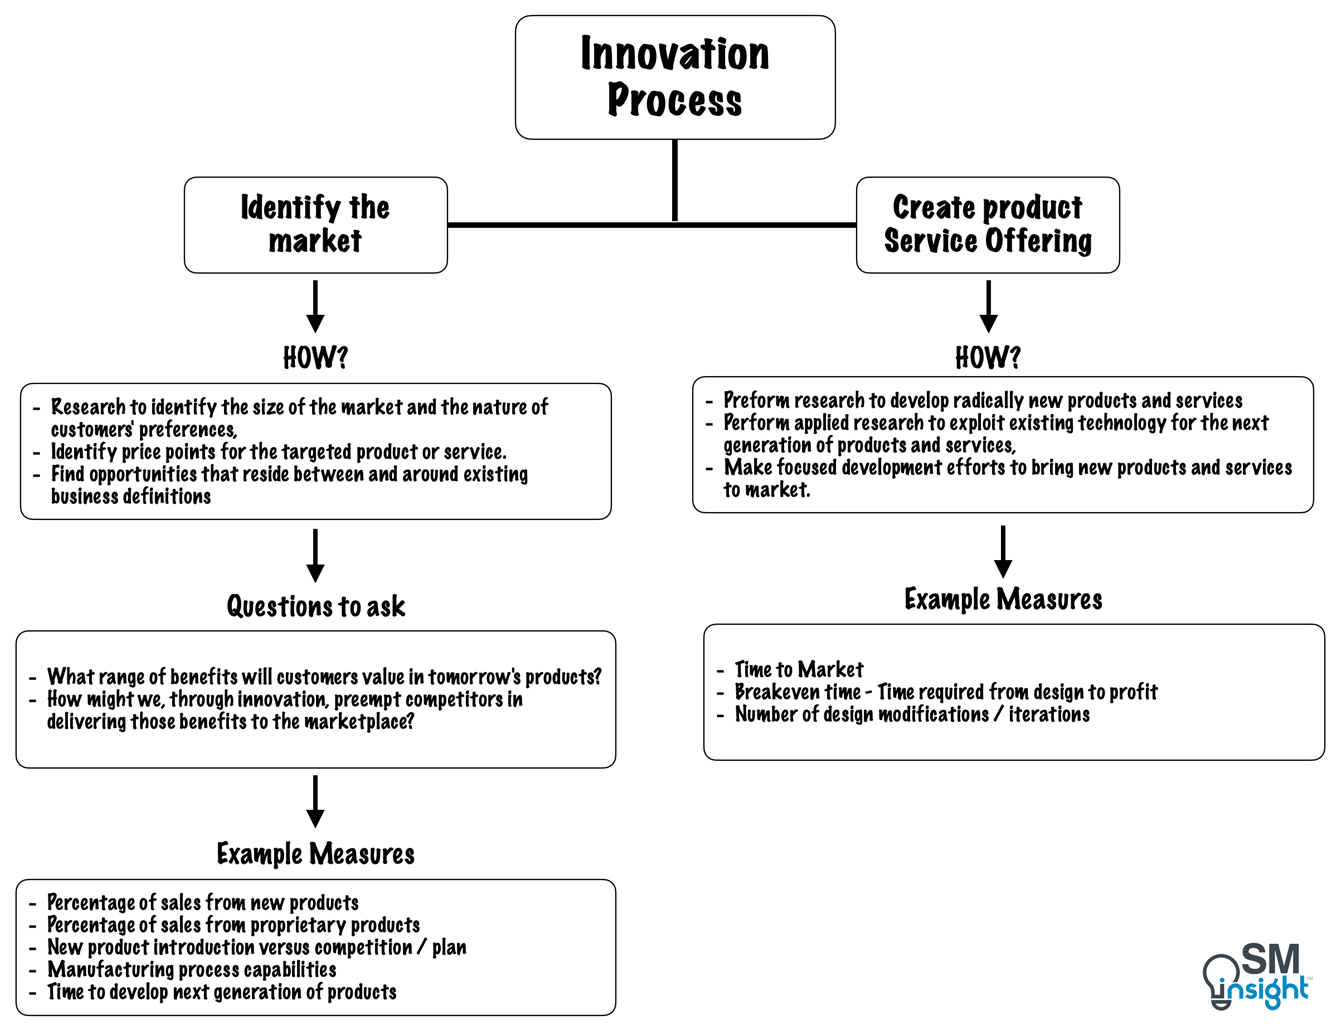
Innovation Process
The first major step in the internal-process value chain is the innovation process which involves researching the emerging or latent customers’ needs and creating products or service offerings.
While traditional scorecards treat innovation and R&D as support processes, BSC advocates treating them as critical internal processes. For many companies, (such as those in pharma, agricultural chemicals, software, and high-tech electronics) this is even more important than excellence in the day-to-day operations.
Additionally, most of the costs occur and are designed in the R&D stages which makes innovation an integral part of the internal-business-process perspective.
The innovation process consists of two faces – identifying new markets and developing products/services. The approach to innovation along with the respective measures, is as shown:
Operations process
These are processes that start with the receipt of a customer order and end with the delivery of the product or service to the customer. They impact the efficient, consistent, and timely delivery of existing products and services to existing customers.
Traditionally, these processes were measured using financial measures, such as costs, budgets, and variances that led to highly dysfunctional actions.
For example, keeping labour and machines busy meant building inventory not related to current customer orders. Switching from supplier to supplier to chase cheaper purchase prices meant poor compromising supplier relations and quality.
However, total quality management and time-based competition practices of leading Japanese manufacturers have led many companies to supplement the traditional approach with quality and cycle time measures.[12]
Post-sale service
Companies that sell sophisticated equipment or systems know that any downtime on their equipment is extremely expensive and inconvenient to their customers. These companies enhance the value of their equipment by offering rapid, reliable service to customers to minimize such disruptions.
They even imbed electronic technology in their equipment that senses and transmits signals to company service personnel when the equipment shows signs of imminent failure.
For example, using the Internet Of Things (IoT), Tesla issues Over-The-Air (OTA) updates to its electric cars and can even perform remote maintenance and service.[13]
Such technology enables repair people to show up on-site to perform preventive maintenance, often surprising customers who have yet to notice any degradation in equipment performance.
Customer satisfaction scores, along with measures such as time to service, quality, and cost metrics, can be used to monitor the effectiveness of post-sale service.
Learning and growth perspective
The objectives in the learning and growth perspective provide the infrastructure to enable ambitious objectives in the other three perspectives of the BSC. They act as the drivers for achieving excellent outcomes.
BSC stresses the importance of investing for the future, and not just in traditional areas such as equipment and R&D. Under the learning and growth perspective, it identifies three principal categories: Employee capabilities, Information systems capabilities and Motivation, empowerment, and alignment.
Capability of Employees
An organization must continually improve just to maintain its existing relative performance. Such an improvement depends on the ability of its employees to innovate and improve processes and performance.
Sometimes, this requires major reskilling so that employee’s minds and creative abilities can be mobilized to achieve organizational objectives.
Core Drivers
Companies can make use of three core outcome measurements (shown below) which can be supplemented with situation-specific drivers of the outcomes.
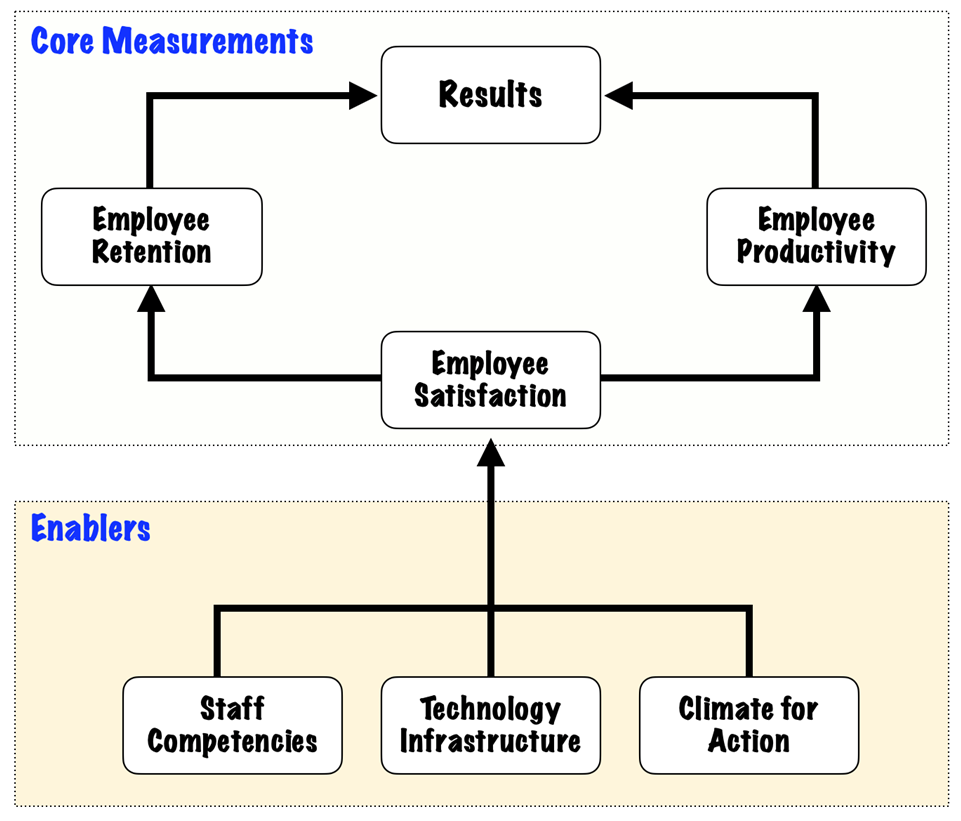
Within this core, the employee satisfaction objective is generally considered the driver of the other two measures, employee retention and employee productivity.
Elements in employee satisfaction measures could include:
- Involvement with decisions
- Recognition for doing a good job
- Access to sufficient information to do the job well
- Active encouragement to be creative and use initiative
- Support level from staff functions
- Overall satisfaction with the company
Employee retention is generally measured by the percentage of key staff turnover while revenue per employee is the commonly used measure for employee productivity.
Situation-specific drivers
Beyond satisfaction, retention, and productivity, companies must identify situation-specific, unique measures from the learning and growth perspective. These measures could include:
| Staff Competencies | Technology Infrastructure | Climate for Action |
|---|---|---|
| Strategic skills | Strategic Technologies | Key decision cycle |
| Training levels | Strategic Databases | Strategic focus |
| Skill leverage | Experience capture | Staff empowerment |
| Proprietary software | Personal alignment | |
| Patents, copyrights | Morale | |
| Teaming |
Capability of Information systems
Employees need accurate and timely information about the various aspects of the organization.
For example, marketing employees might need a summary of a customer’s total relationship with the organization while the operations side of the business may need rapid, timely, and accurate feedback on the product just produced or the service just delivered.
Excellent information systems are key to improving processes through redesign and reengineering. Organizations can use a metric known as strategic information coverage ratio to assess the current availability of information relative to anticipated needs.
It measures the extent to which critical information required for strategic decision-making is readily accessible. This ratio can be calculated using various metrics, such as the percentage of processes with real-time quality, cycle time, and cost feedback available, as well as the percentage of customer-facing employees with online access to customer information.
Motivation, empowerment, and alignment
Employees will contribute to success only when they are motivated to act in the best interest of the organization and have the freedom to make decisions and act.
Hence, the learning and growth perspective of BSC must include measures related or motivation and empowerment.
The most commonly used ones are the number of suggestions per employee, and the number of suggestions implemented (indicates the quality of suggestions). It is also important to communicate to the workforce that their suggestions are valued and taken seriously.
For example, recognizing successful suggestions and having a reward structure in place increases the visibility and motivation of employees to make suggestions.
Likewise, the BSC measures must also focus on whether departments and individuals have their goals aligned with the company objectives articulated in the scorecard. Such alignment measures could include:
- Percent of top managers exposed to BSC
- Percent of staff exposed to BSC
- Percent of top managers with personal goals aligned to BSC
- Percent of staff with personal goals aligned to BSC
- Percent of employees who achieved personal goals
Constructing a balanced scorecard
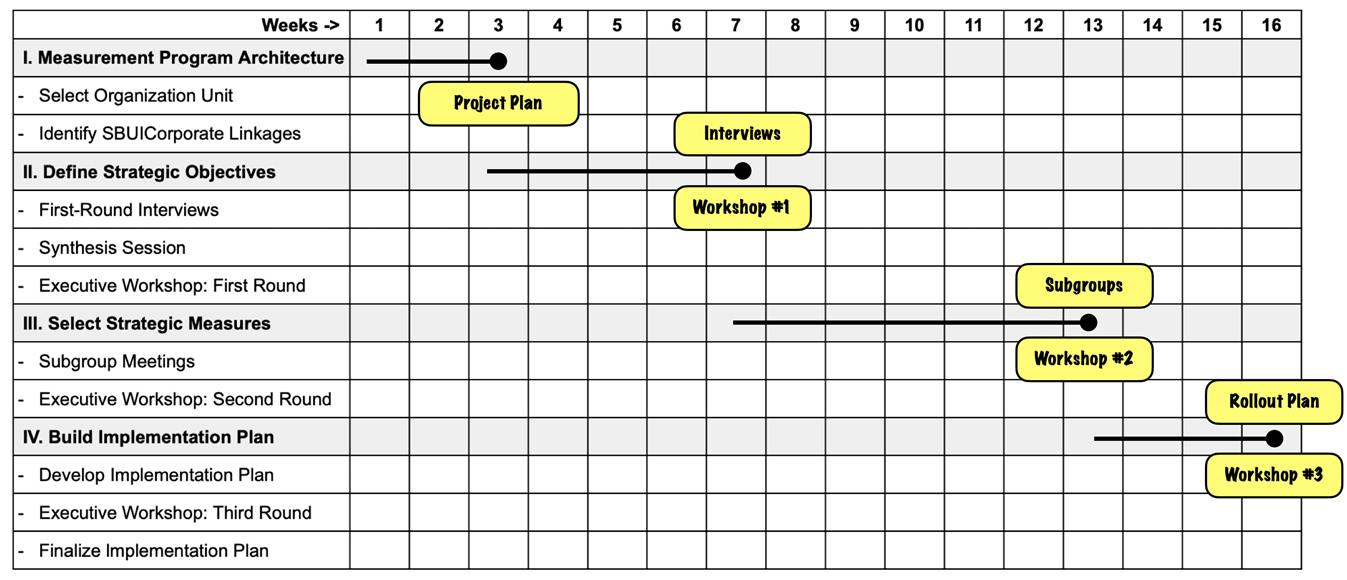
Creating an organization’s first balanced scorecard requires ten steps, broadly categorized into four stages. Dr. Robert Kaplan and Dr. David Norton suggest a 16-week timeline for implementation as shown:
Task 1: Selecting organization unit
The first step is to select the business for which the scorecard is to be developed. A strategic business unit (SBU) is a good starting point.
Ideally, the selected SBU must conduct activities across an entire value chain that includes innovation, operations, marketing, selling, and service.
The below figure shows a typical structure for a hierarchically organized company. The natural setting for a Balanced Scorecard is at level 3 of such an organization.
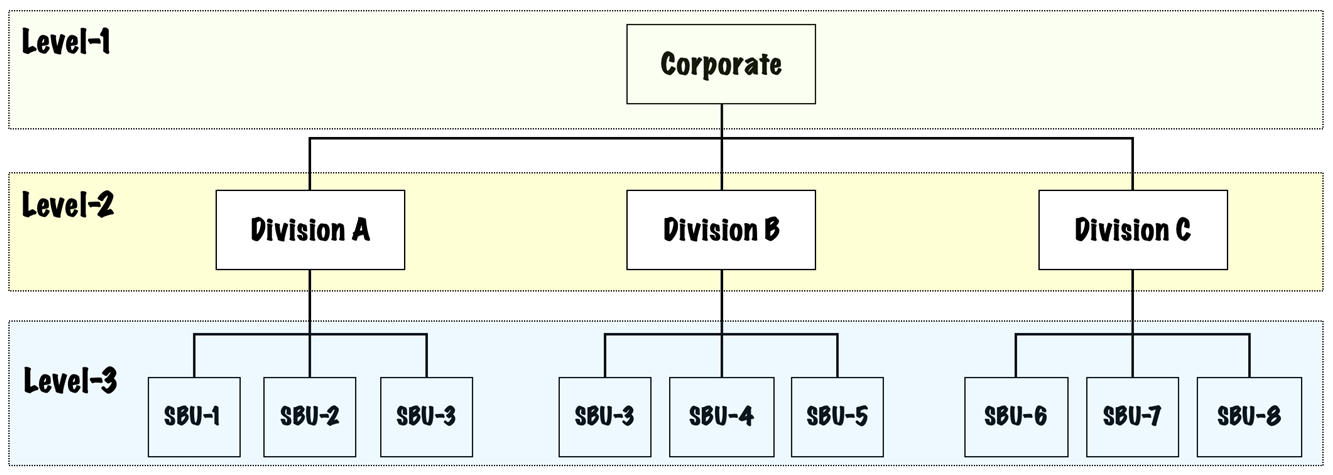
The process of selection of a business unit must be performed in consultation with the senior executive team of the business unit for which BSC is to be constructed.
Task 2: Identify SBU/Corporate Linkages
The task involves conducting interviews with key senior divisional and corporate executives to learn about:
- Financial objectives for the SBU (growth, profitability, cash flow, harvest)
- Overriding corporate themes (environment, safety, employee policies, community relations, quality, price competitiveness, innovation)
- Linkages to other SBUs (common customers, core competencies, opportunities for integrated approaches to customers, internal supplier-customer relationships)
Understanding linkages is crucial to identifying constraints and opportunities that might not be apparent if the SBU were considered a completely independent organizational unit.
This also ensures that the SBU does not develop objectives and measures that optimize its performance at the expense of the entire corporation.
Task 3: Conducting the first round of interviews
Conducting interviews requires the following preparations:
- Bringing clarity on the SBU’s vision, mission, and strategy
- Information on the industry and competitive environment of the SBU
- Significant trends in market size and growth
- Competitors and competitor offerings, customer preferences, and technological developments.
After each senior executive has reviewed the above, the BSC architect must conduct interviews. The interview’s explicit objectives are to introduce the concept of the BSC to senior managers, respond to their queries, and get their initial input about the organization’s strategy, and how this translates into objectives and measures for the scorecard.
The implicit objectives are to get top managers to start thinking about how to turn their strategy and goals into practical actions, understand concerns, and spot conflicts.
Task 4. Synthesis session
The purpose of this session is to discuss interview responses, highlight issues, and develop a tentative list of objectives and measures that will provide the basis for the first meeting with leadership.
The team should attempt to determine whether the tentative list of prioritized objectives represents the business unit’s strategy and whether the objectives across the four perspectives appear to be linked in cause-and-effect relationships.
These observations serve as discussion questions during the executive workshop to follow.
Task 5. Executive workshop: First Round
This involves a top management group debate on the mission and strategy statements until a consensus is reached. The group must then answer the question:
“If I succeed with my vision and strategy, how will my performance differ for shareholders, for customers, for internal business processes, and for my ability to grow and improve?”
This is followed by the ranking of the proposed objectives. Each objective should be discussed in its own right. Its specific relevance, strengths, and weaknesses can be explored and not compared to others. Narrowing the choices is not critical at this stage.
After all the objectives for a perspective have been introduced and discussed, the group votes on the top three to four candidates.
By the end of the workshop, the executive team will have identified three to four strategic objectives for each perspective, a detailed descriptive statement for each objective, and a list of potential measures for each objective.
Task 6. Subgroup Meetings
Subgroup meetings have four principal objectives:
- Refining the wording of the strategic objectives in line with the intentions expressed in the first executive workshop.
- Identifying the measure or measures that best capture and communicate the intention of the objective.
- Identifying the sources of the necessary information and the actions that may be required to make this information accessible.
- Identifying the key interlinkages among the measures within different perspectives of the BSC.
The final output from the subgroups should be, for each perspective:
- A list of the objectives for the perspective, accompanied by a detailed description of each objective
- A description of the measures for each objective
- An illustration of how each measure can be quantified and displayed
- A graphic model of how the measures are linked within the perspective and to measures or objectives in other perspectives.
Task 7. Executive Workshop: Second Round
This workshop is attended by the senior management, their direct subordinates, and a larger number of middle managers. They must debate the organization’s vision, strategy statements, and tentative objectives and measures for the scorecard.
A good focus for this second workshop is to be able to sketch out a brochure to communicate the scorecard intentions and contents to all employees of the business unit.
A secondary objective would be to encourage participants to formulate stretch objectives for each of the proposed measures, including targeted rates of improvement.
Depending on the organization’s philosophy, a variety of target-setting approaches such as benchmarking to rates of change can be used to specify targets for the next three to five years.
Task 8. Develop the implementation plan
A newly formed team, often made up of the leaders of each subgroup, formalizes the stretch targets and develops an implementation plan for the scorecard.
This plan includes:
- Linking the measures to database and information systems
- Communicating the BSC throughout the organization
- Encouraging and facilitating the development of second-level metrics for decentralized units.
In some cases, an entirely new executive information system that links top-level business unit metrics down through shop floor and site-specific operational measures could be developed.
Task 9. Executive workshop: Third Round
This is a final meeting of the senior executive team to reach a consensus on the vision, objectives, and measurements developed in the first two workshops, and to validate the stretch targets proposed by the implementation team.
Preliminary action programs to achieve the targets are also identified in this step.
By the end of the workshop, the executive team should agree on an implementation program to communicate the scorecard to employees, integrate the scorecard into a management philosophy, and develop an information system to support the scorecard.
Task 10. Finalizing the implementation plan
To ensure the BSC is effective, it should be integrated into the organization’s management system. (ideally within a 60-day timeframe).
It’s important to create a gradual plan that aligns with the scorecard’s priorities based on the best available information. Over time, the management information systems adapt to this process.
Sources
1. “The Balanced Scorecard—Measures that Drive Performance”. HBR – Robert S. Kaplan and David P. Norton, https://hbr.org/1992/01/the-balanced-scorecard-measures-that-drive-performance-2. Accessed 12 Sep 2023
2. “The Balanced Scorecard: Translating Strategy into Action”. Robert S. Kaplan and David P. Norton, https://www.amazon.com/dp/0875846513. Accessed 13 Nov 2023
3. “The Value of Keeping the Right Customers”. Harvard Business Review, https://hbr.org/2014/10/the-value-of-keeping-the-right-customers. Accessed 16 Sep 2023
4. “Prescription for cutting costs”. Bain & Company (Fred Reichheld), https://media.bain.com/Images/BB_Prescription_cutting_costs.pdf. Accessed 16 Sep 2023
5. “Why Should You Care About Customer Lifetime Value?”. Easy Online Biz Solutions, https://easyonlinebizsolutions.com/marketing/customer-lifetime-value/. Accessed 16 Sep 2023
6. “Customer Churn Rate: What Is The Average for Ecommerce & How To Calculate”. Emmanuel Emeka, https://blog.converted.in/en-us/blog/customer-churn-rate-how-to-calculate-and-reduce-it. Accessed 16 Sep 2023
7. “10 MOST Important Customer Acquisition Metrics”. HockeyStack, https://hockeystack.com/blog/customer-acquisition-metrics/. Accessed 16 Sep 2023
8. “The One Number You Need to Grow”. Harvard Business Review, https://hbr.org/2003/12/the-one-number-you-need-to-grow. Accessed 16 Sep 2023
9. “MOVE TO ZERO”. Nike, https://www.nike.com/in/sustainability. Accessed 16 Sep 2023
10. “The World’s Top 10 Activewear Brands, Ranked on Sustainability”. Attiremedia, https://www.attiremedia.com/popular-brands/top-10-activewear-brands-ranked-on-sustainability. Accessed 16 Sep 2023
11. “Chip Wilson, Lululemon Guru, Is Moving On”. The New York Times Magazine, https://www.nytimes.com/2015/02/08/magazine/lululemons-guru-is-moving-on.html?_r=0. Accessed 17 Sep 2023
12. “Manufacturing Cycle Time: A Complete Guide”. Deskera, https://www.deskera.com/blog/manufacturing-cycle-time/. Accessed 17 Sep 2023
13. “Tesla’s Over-the-Air Fix: Best Example Yet of the Internet of Things?”. Wired, https://www.wired.com/insights/2014/02/teslas-air-fix-best-example-yet-internet-things/. Accessed 17 Sep 2023