Markets today are characterized by an abundance of options. From dining out to acquiring an automobile to deciding the next smartphone upgrade, consumers face an increasing number of choices.
If companies could find a way to stand out from the crowd in the eyes of their customer, they could outperform competitors. A perceptual map is a tool that helps do just that.
What is a Perceptual Map
A perceptual map is a strategic marketing tool used to determine a brand’s perceived position in the marketplace by visually representing what customers think of the brand, as well as its competitors, using attributes that are important to consumers.
Built upon robust consumer perception data, a perceptual map often replaces informed, but somewhat subjective judgments of managers to make more accurate predictions on how a market will react to a firm’s offerings.
Concept of a perceptual map
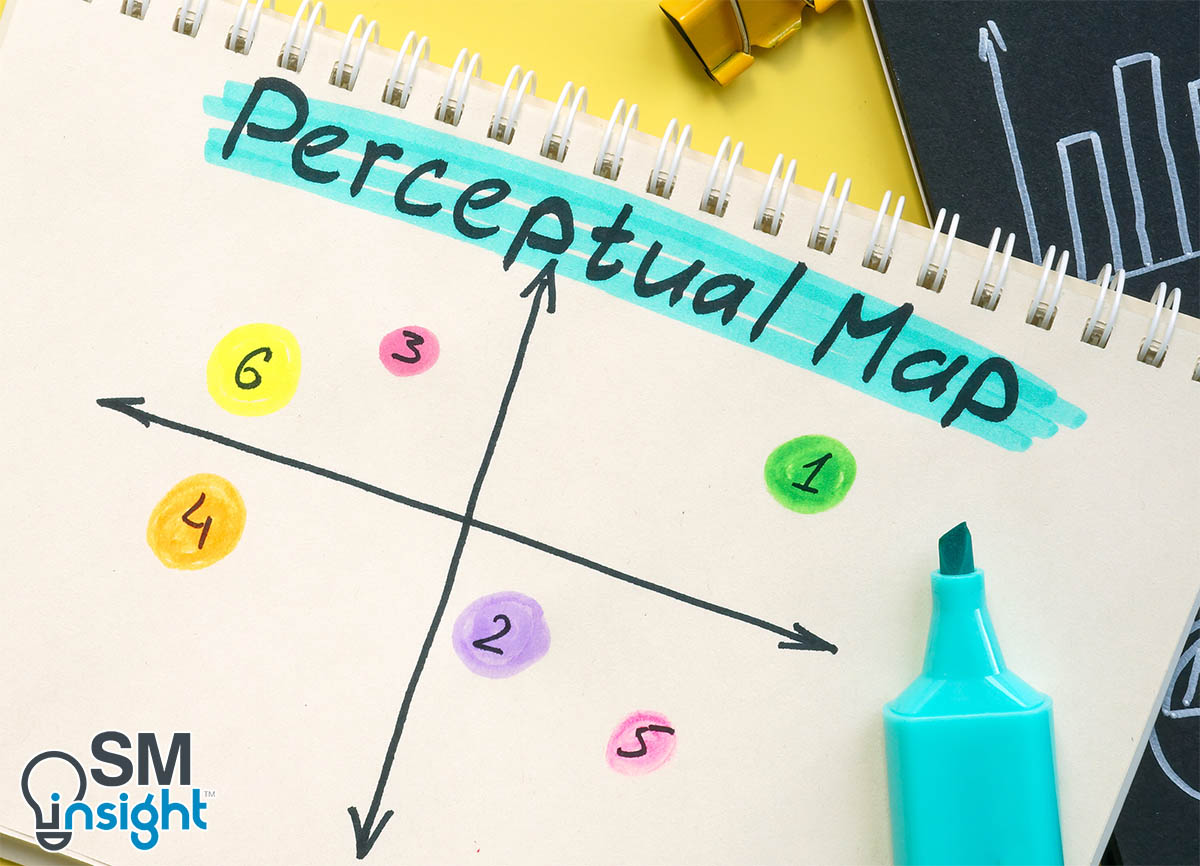
Perceptual maps illustrate how target customers view the competing alternatives in an Euclidean space, which represents the market:
They can take various forms, ranging from a simple two-variable comparison to one in which many variables are used. These selection variables are also known as dimensions or attributes.
Consumers’ ratings of these critical attributes are used to place the brands on the map. Attributes can be either objective or perceived, but a perceptual map is always based on perceived attributes, which may not coincide with (or even include) the objective dimensions assumed by the researcher.
For example, a firm may see their new model of the lawnmower as having two color options (red versus green) and a 24-inch blade. These are the objective attributes. However, customers may not see these attributes at all and instead perceive the lawnmower to be expensive-looking or fragile.
Also, the evaluations of such perceived attributes may not be independent and may not agree. For example, customers may judge a soft drink to be sweeter than others because it has a fruitier aroma, although both contain the same amount of sugar.
Developing perceptual Maps
The easiest way to develop a perceptual map for a product is to ask consumers to name the two most important differentiating attributes and then rate each product on those attributes. While this might work well in some situations, in general, just two attributes are insufficient to develop a reliable map.
Hence researchers use two major alternatives for constructing maps, that differ in what is asked of consumers: The Attribute Rating method (AR) and the Overall Similarity method (OS).
Attribute Rating Method
The AR method is similar to the two variables method, except that the consumers are presented with a full list of possible relevant attributes, and they rate each item on each of those attributes.
This method is suited to cases where relevant product attributes are easy to identify and articulate. For example, in an industrial context, Dow’s Specialty Chemical Group used this approach to assess consumers’ perception of Dow vs. Competitors on eight attributes[2]:
- Meets scheduled delivery dates.
- Practices innovation and development.
- Has fair pricing.
- Has consistent product.
- Provides support in solving processing problems.
- Has custom color capability.
- Provides adequate technical literature.
- Withstands high heat distortion temperatures.
The resulting data from such an approach can be represented as a “Data Cube”:
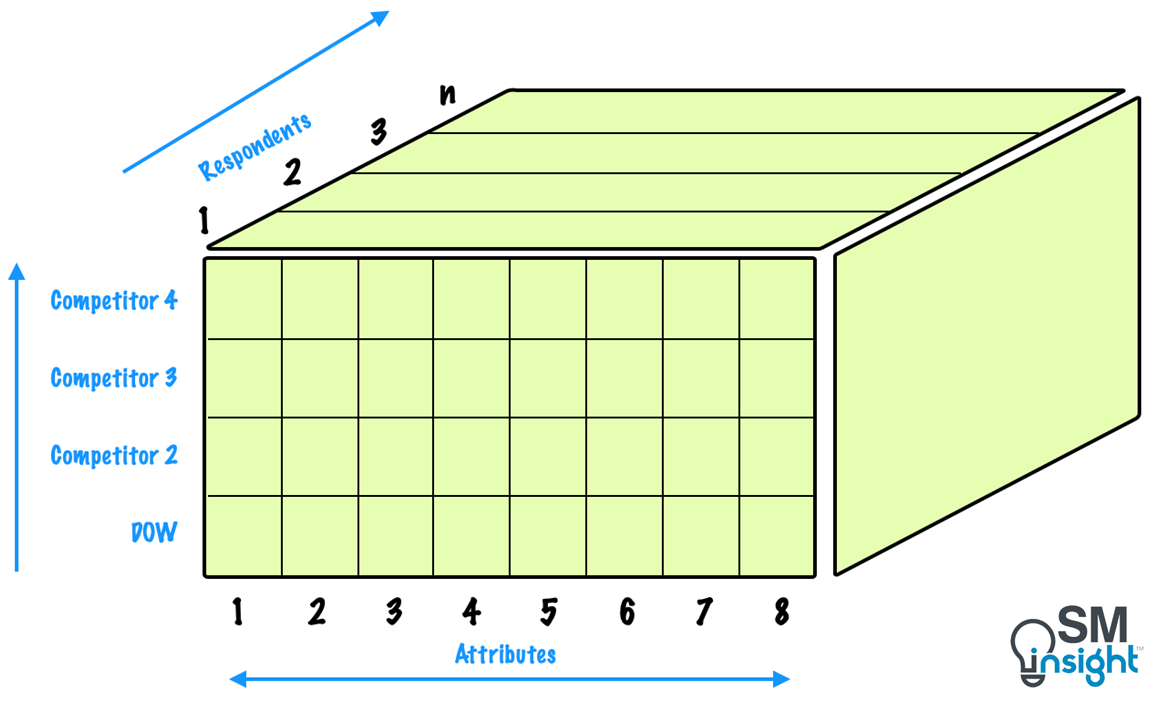
Every respondent must provide 32 (8 x 4) ratings for each brand/vendor on the eight attributes. As seen from the above figure, for N respondents, this data can be stacked together as a data cube of 32 x N numbers.
Statistical analysis is then used to extract information and insights from the data. This involves the use of computerized algorithms and software based on statistical methods such as Factor Analysis[4] and Multi-Discriminant Analysis.[5]
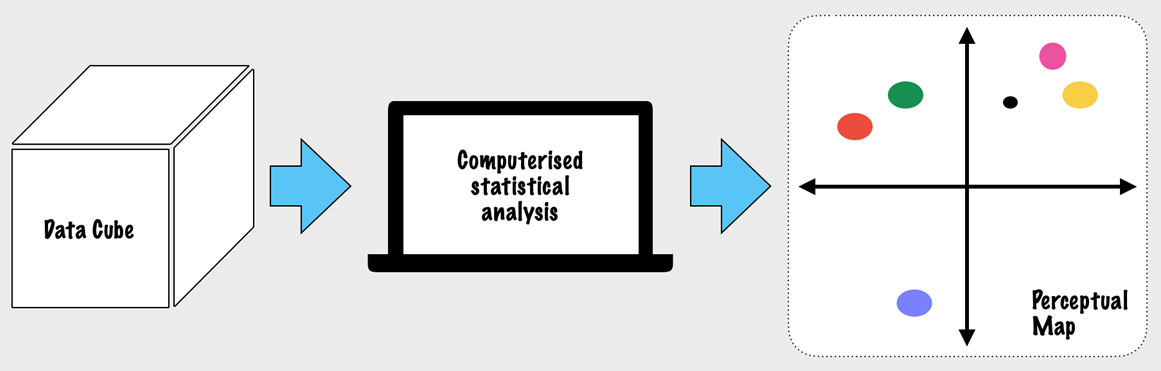
While such statistical methods involve complex mathematics that is beyond the scope of this article, the general philosophy is to find the two axes for the perceptual map that conveys the most information in the data cube.
This is accomplished by including the original attributes but with different weights. What the statistical analysis software does is to “look” at situations such as shown below:
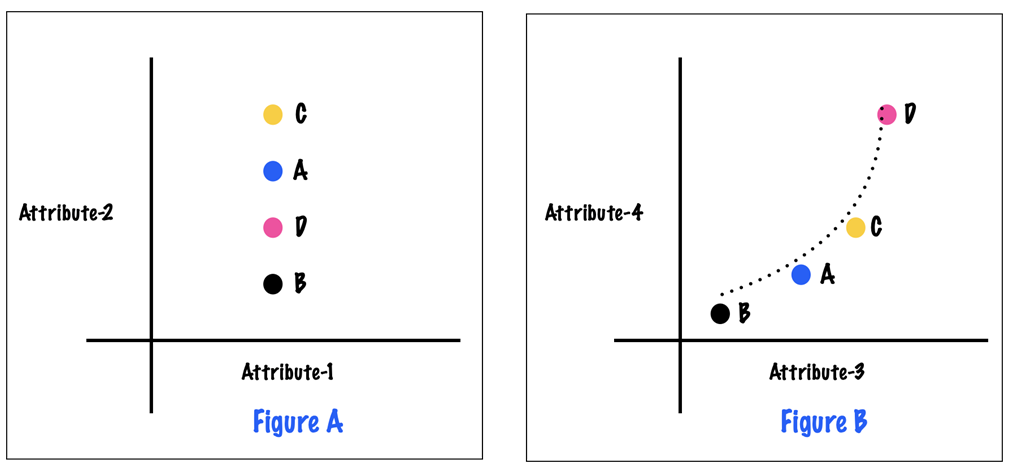
In Figure A, all vendors are rated identically for attribute #1, making it an uninteresting product feature. Hence the software does not give much importance to it in portraying the situation. Attribute #2, however, varies across products and would have a place in the final map.
Similarly, in Figure B, attributes #3 and #4 are highly correlated, i.e., the vendors rated high on #3 are also rated high on #4. The software would thus treat #3 and #4 as measurements of the same underlying construct.
By extending this logic, the analysis collapses down from the original set of attributes to a two-dimensional map with the four vendors positioned on the axes. However, a perceptual map cannot capture all the variations among the vendors given in the data matrix.
In Dow’s example earlier, since the original data had eight dimensions (attributes) and the perceptual map was reduced to two, an information loss in the process is inevitable.
What a perceptual map essentially does is retain the most important information from the full data matrix (the best it can) and report it in two dimensions to provide a visual impact.
While effective, the AR method has one key limitation – it requires the researcher to articulate, and the respondent to think, in terms of attributes. This makes it unsuitable for products that cannot be described using attributes, for example – soft drinks or perfumes.
When the competition is driven by tastes, odors, or aesthetics, i.e., things that cannot be verbalized well, the AR method breaks down. In such situations, the OS method is preferred.
Overall Similarity Method
The OS method produces a map similar to that of AR, but the input data used is very different. Instead of specifying attributes of the products, respondents are asked to simply make judgments about the overall similarity of pairs of items.
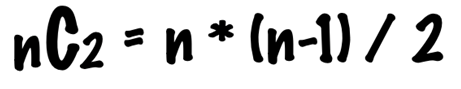
Thus, for any given n items, the respondents must rank nC2 (n combination 2) possible pairs from most similar to least similar.
To explain the OS method with an example, consider a study that seeks to understand consumers’ perceptions of six candy bars on the market. Instead of trying to gather information about consumers’ evaluation using attributes, the researcher gathers only perceptions of overall similarities or dissimilarities.
Data is typically gathered by having customers respond to statements such as:
- Rate the similarity of products A and B on a 10-point scale.
- Product A is more similar to B than to C.
- I like product A better than product C.
From these simple responses, a perceptual map can be drawn that best portrays the overall pattern of similarities among the six candy bars as follows:
- Responses are collected by first creating a set of 15 unique pairs of the six candy bars (6C2 = 15).
- Then the respondents are asked to rank the 15 candy bar pairs (shown below), such that rank 1 indicates the most similarity and rank 15 indicates the least.
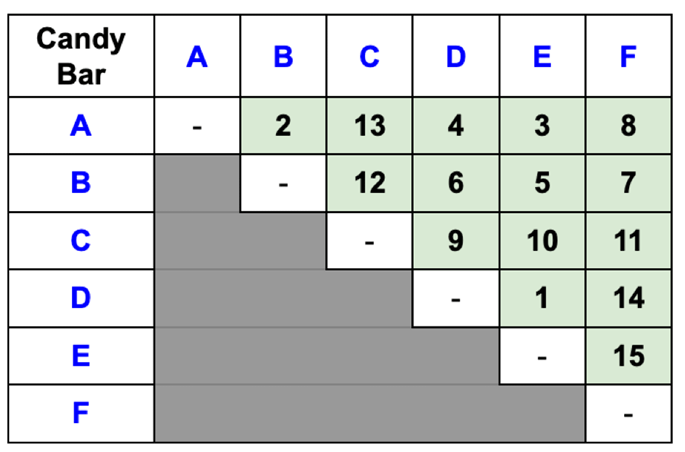
The respondents represented in the above figure thought that candy bars D and E were the most similar, then A and B and so on while E and F were the least similar.
This similarity among candy bars can be illustrated graphically on one dimension using a single similarity scale, which for the bars A, B and C would look like:
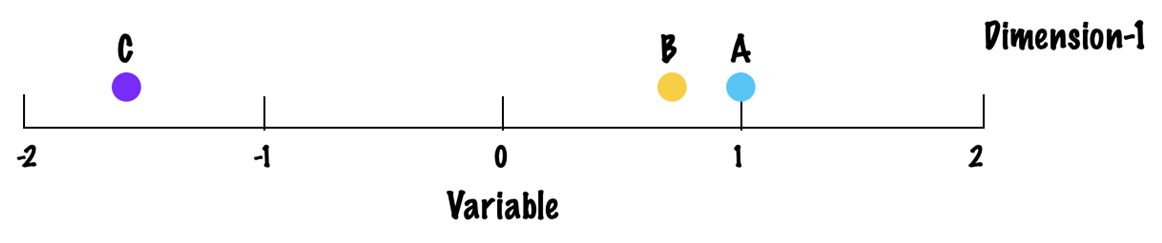
While this can be accomplished with three objects, the task becomes increasingly difficult as the number of objects increases.
Because one-dimensional scaling does not fit the data well, a two-dimensional solution can be attempted. This allows for another scale (dimension) to be used in configuring the six candy bars, as shown:
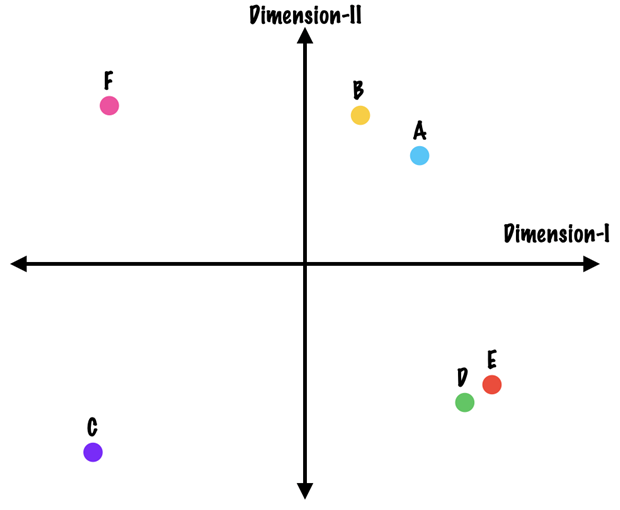
This two-dimensional map is constructed using a technique known as Multidimensional Scaling[6] which attempts to find a map such that the distance between the candy bars as shown on the map match up with the rank numbers in the input data matrix.
The output of multidimensional scaling is a plot (as shown above) and a statistic that tells how closely the distances on the map match up with the original input data.
However, it is still not known what the axes (dimensions) are. The knowledge of the category can help name them.
For example, if the candy bars A, B and F are sweeter than the rest, then the vertical axis might suggest sweetness levels. Similarly, if A, B, D and E are to contain chocolate, the horizontal axis might suggest the amount of chocolate as an influencing factor.
The OS method thus not only maps products, but also infers the attributes used by the respondent in making distinctions. However, these inferences can be somewhat subjective. For example, one might argue that the horizontal axis represents size instead of amount of chocolate. The method also requires that the analyst is knowledgeable about the object.
OS method has been used in developing perceptual maps in various industries, including Retail stores[7], Desserts and Food Products[8], Ethical Drugs[9] and Cigarette Brands.[10]
AR vs OS method
A comparative summary of both methods is as shown:
| Attribute Rating method | Overall Similarity method |
|---|---|
| Input Data | |
| Brand ratings on attributes | Overall similarity ranking |
| Attributes prespecified by analyst | Definition of similarity left to respondent |
| Statistical technique | |
| Factor analysis or Multiple Discriminant Analysis (software generally available) | Multidimensional scaling (requires special-purpose software, but are available at low cost) |
| Output | |
| Product positions on axes defined as combination of original variables | Relative product positions; axes must be interpreted by analyst |
| Best suited for | |
| Applications with hard attributes that can be verbalized | Categories dominated by not easily articulated attributes |
While the input data is the deciding factor in the choice of method, the OS method requires specialized software and is better suited for applications where more than eight brands are to be mapped. AR and OS can also be viewed as complements to one another rather than substitutes.
Types of perceptual maps
Two-dimensional perceptual maps
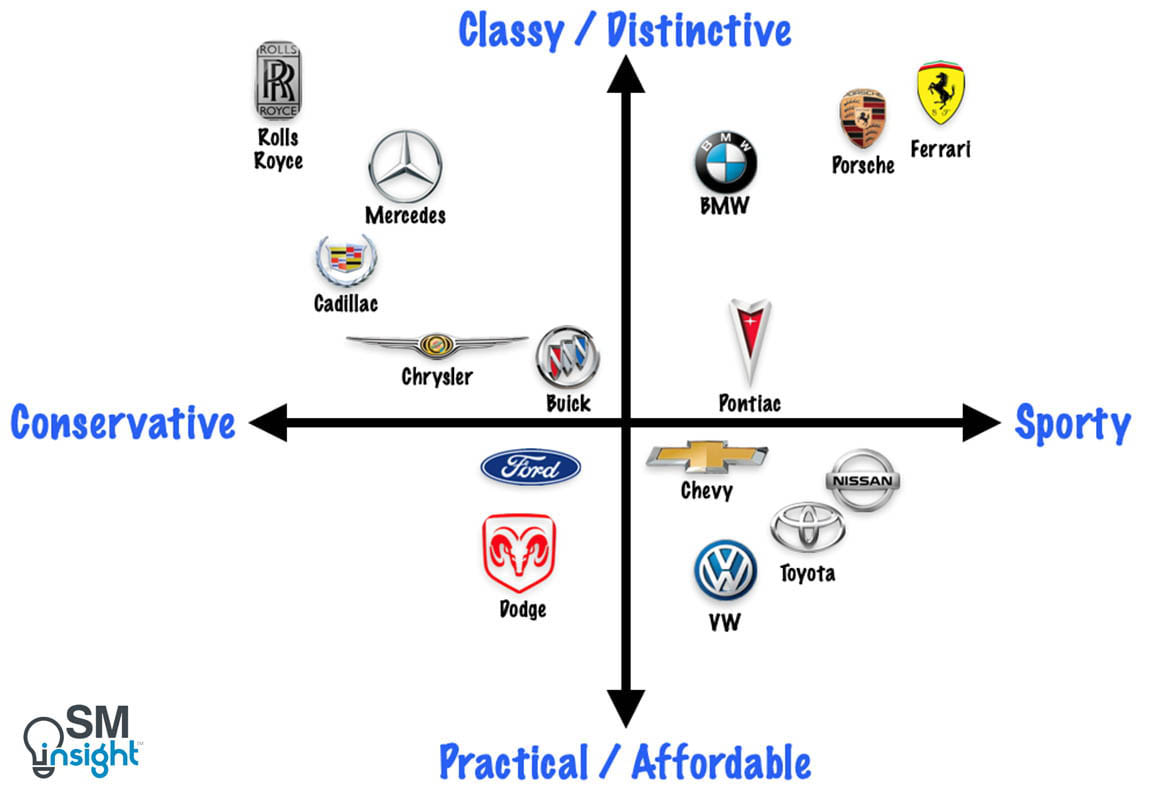
These are the most commonly used types of perceptual maps that use a vertical and a horizontal axis to convey information.
Those positioned close to each other are considered to have many similar attributes. The perceptual map of competing automobile brands (shown at the beginning of this article) is an example of a two-dimensional perceptual map.
Multidimensional perceptual maps
Researchers are not limited to two-dimensional representations of the relationships. Modern statistical software and machine learning techniques (self-organizing maps[11]) can produce multivariate maps that can represent several dimensions in the final map.
Consider the below example, which shows customer perceptions of beverage brands along 13 dimensions: Available, Youthful, Sparkling, Healthful, Thirst-quenching, Refreshing, Light, Health-conscious, Good-for-you, Natural, Adult, Filling and Sweet.
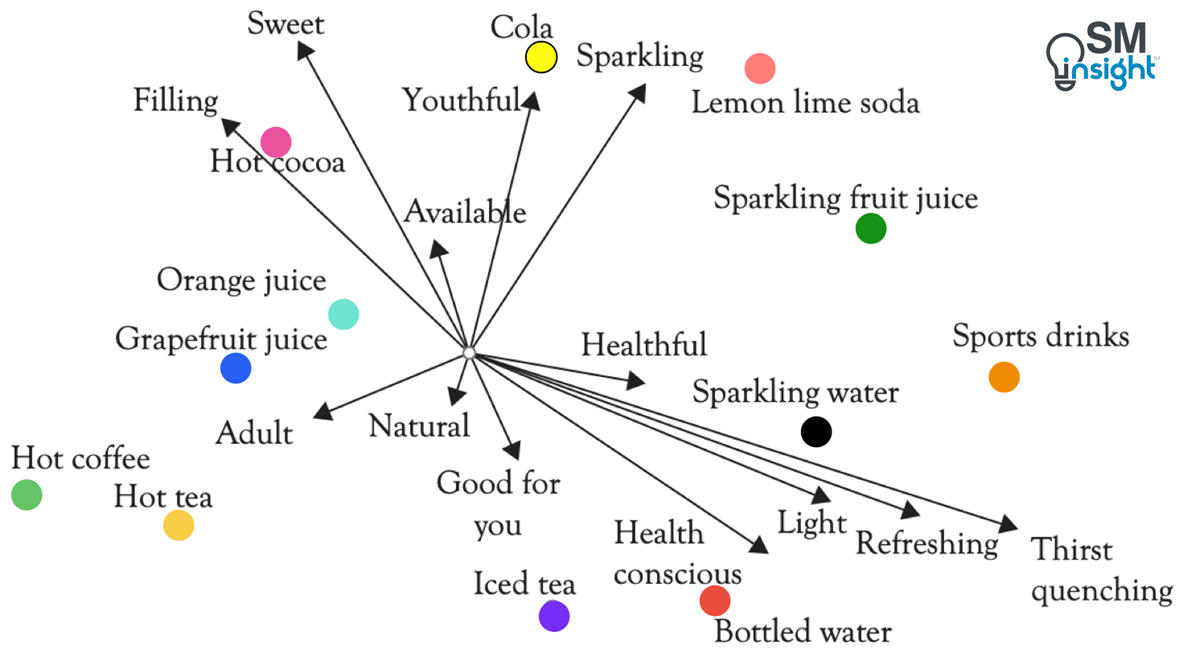
Each of these dimensions is represented as a vector, and its length indicates relative importance in the eyes of the customer. A brand’s position in the map can then be projected along these vectors to show how “aligned” the brand is to any of these dimensions.
Joint perceptual maps
A joint perceptual map integrates both, the consumer’s perceptions of the various competing brands and their notion of ideal attributes for different consumer segments.
![Joint perceptual map for beverages (Data source: Awware[13])](https://strategicmanagementinsight.com/wp-content/uploads/Joint-perceptual-map-for-beverages.png)
The joint perceptual map in the above example depicts the positions of various cold-drink brands (Coke, Pepsi, Sprite etc) along the dimensions of sugar and caffeine content. It also shows the ideal position for various customer segments as seen from the customer’s eyes (ex: kids, teens etc).
The input data for a joint perceptual map is designed such that customers are also required to provide feedback on ideal positioning points for each market segment after rating the brands.
Joint perceptual maps require greater efforts to develop but are comparatively more powerful and usable in marketing decision-making.
Intuitive maps
These are perceptual maps that are based on a marketer’s understanding of the industry rather than hard data and detailed study. They are also called judgmental maps or consensus maps.
Their applications however are limited as accuracy depends on the intuition of the marketeer.
Spidergrams
A spidergram is more of an alternative rather than a type of perceptual map. It requires that customers rate brands on all of the attributes which are then averaged and plotted on a diagram as shown:
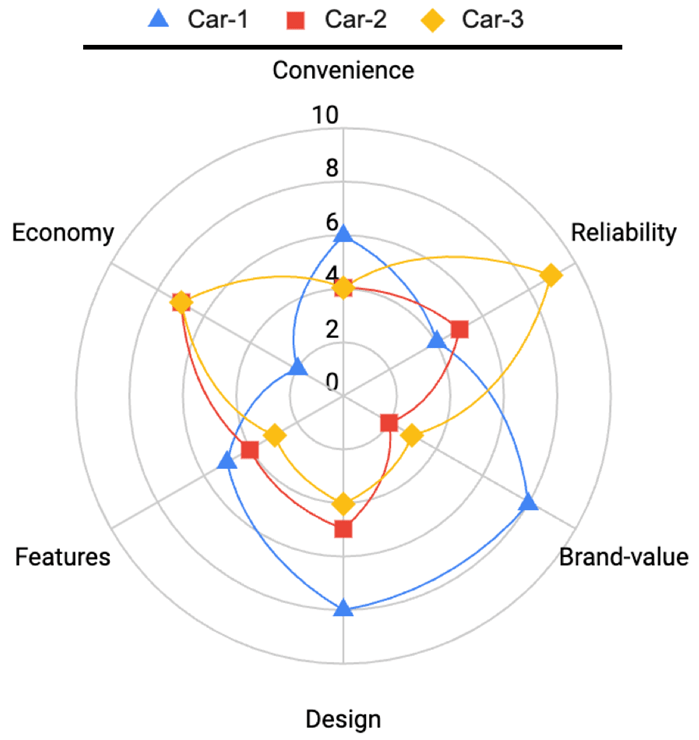
In the example case above, customers have rated three car brands, each on a scale of 0-10, across the six dimensions: Convenience, Reliability, Brand Value, Design, Features, and Economy.
The resulting map shows the relative strengths and weaknesses of each of the brands over the six dimensions on a Spidergram.
Uses of perceptual maps
Perceptual maps find utility across a wide spectrum of fields, including new product development, understanding competition, guiding R&D initiatives, and as a marketing research tool for positioning. Some of its use cases are discussed in more detail:
To better understand the market structure
Perceptual maps help spot market opportunities by identifying “holes” in the product space that might be exploited. These “holes” are the market niches that current competition has overlooked. They also indicate the vulnerability of competitors by showing how consumers perceive them.
Consider the example below, where firm A has a dominant market share (bar chart to the left) which suggests it is seemingly impossible to attack this firm. These market shares are compatible with the perceptual map positions (shown on the right) and the notion that a large proportion of the customers in the category are quite quality-sensitive and hence buy from firm A even though it is perceived as “unfair.”
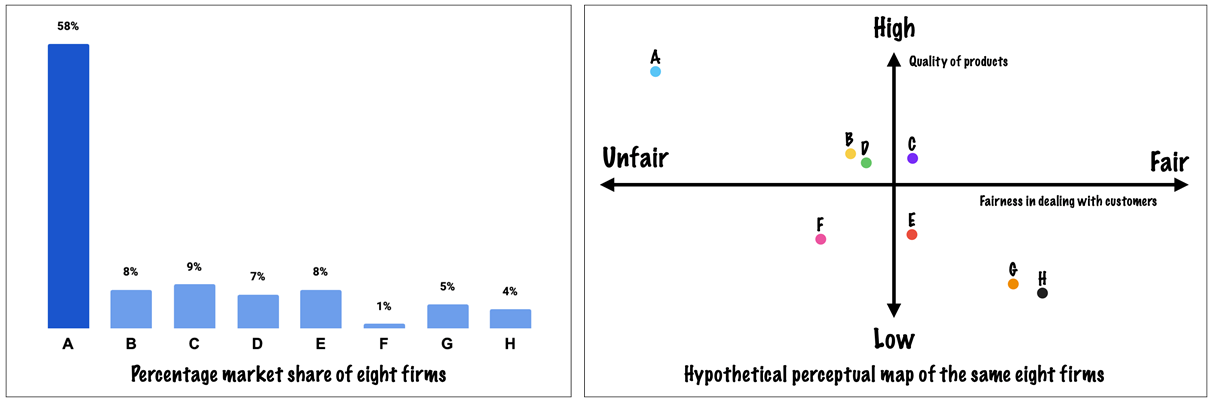
Unlike the bar chart which provides only market share information, the perceptual map helps gain a deeper understanding of customers’ attitudes and perceptions and reveals the means of attacking the seemingly impregnable firm A.
Suppose A were positioned in the map in the upper right-hand quadrant, (say at A’s quality and H’s fairness), there would be no basis for attacking A.
However, a poor position of A’s fairness made apparent by the map indicates vulnerability and that the market share can be taken away if a firm is able to produce a product near A’s quality level and treat customers well simultaneously.
To test the perception of a new product or concept
Once an opportunity for a product or concept is recognized, the subsequent step is concept development. This is followed by testing either in the form of a product usage test or a test market evaluation.
A perceptual map can be created by introducing respondents to the new concept or product, either through a concept statement or by actual product use. Such a map provides crucial data on whether the customers perceive the concept or product as the firm intended them to.
For example, consider an electric appliance manufacturer (let’s call it firm-1) which already participates in the market where the three key attributes are ease of use, flexibility, and price. This firm has a product, let’s call it X.
The perceptual map of the market is shown:
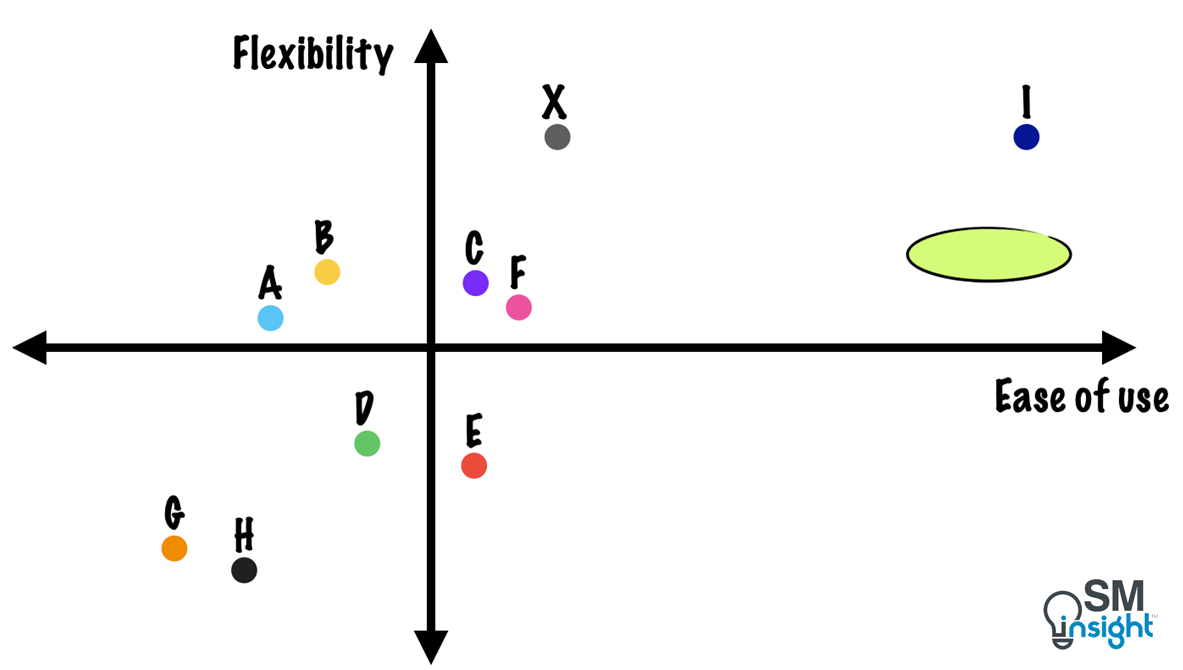
The map reveals that most of product X’s competition is grouped close in the middle of the map while firms G and H offer less flexibility and convenience (presumably at lower prices).
The position of X reveals that the firm has been able to differentiate itself from the group via innovation on flexibility. X is also at a slight price premium (though not depicted in the map) when compared to A, B, C, D, E, and F.
In the same market, another competing firm has a product (I) that has been able to differentiate itself by offering both greater flexibility and greater ease of use but at a significant price premium.
If firm-1 were to consider bringing a new appliance to the market which is very easy to use, but with average flexibility, (in the area of the circle drawn on the map), such a product would sell at the same price level as X, but would not cannibalize X but rather appeal to a market segment currently buying F or I.
The key is to make a reasonable prediction of whether the new appliance could take on this position in customers’ eyes even if, in a technical sense, it provided average flexibility but was quite easy to use.
A perceptual map helps make this prediction. Once consumers understand the proposed product, a mapping study can be conducted to see where the new product falls. The figure below shows the four zones where the new appliance could possibly lie:
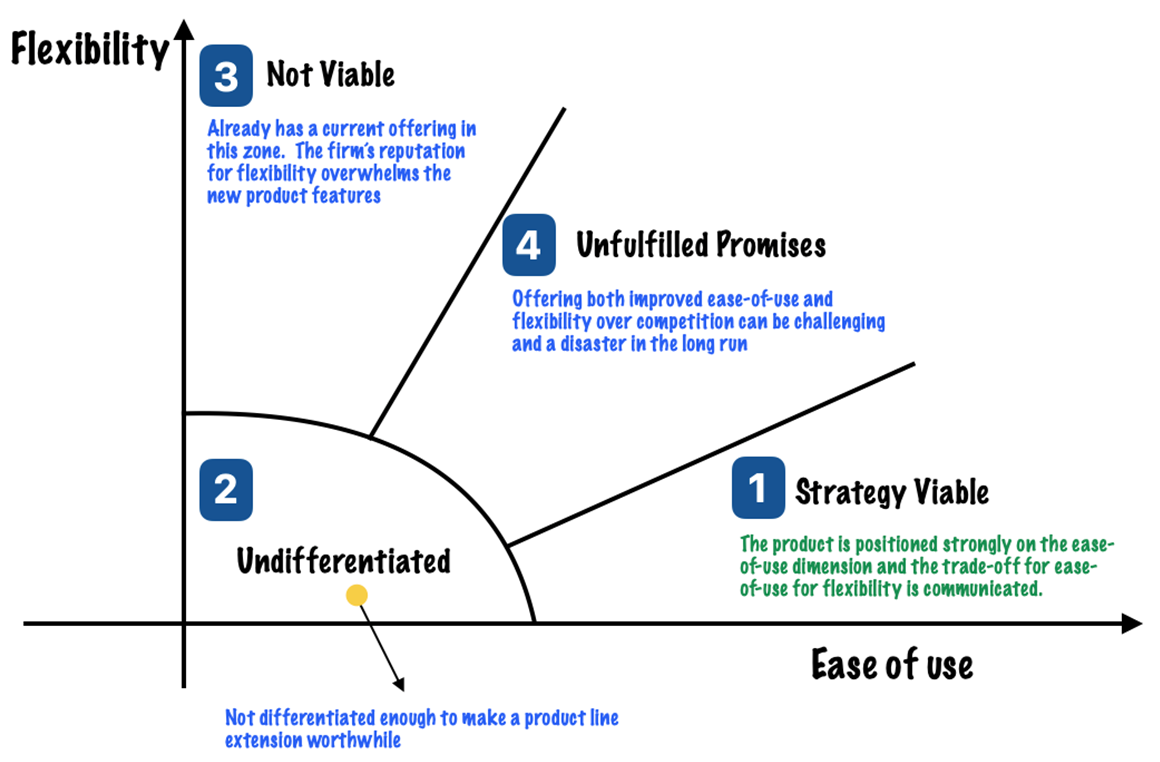
If the position of a new product lies in Zone 2, 3 or 4 each of which has unintended consequences, the firm can take corrective action to ensure product success.
Similarly, a perceptual map can be used after a product introduction to track the positioning.
In the above example, suppose the study showed the new product to be on the border between Zones 1 and 4. This could suggest that the respondents had limited communication about the new product and that the actual introduction must be accompanied by extensive marketing to place the product squarely in Zone 1,
This diagnostic information complements the firm’s ability to predict the market share that a proposed new product could achieve.
As a tool for market positioning
Getting product positioning right is vital for the survival of companies. Most products and services have many physical and intangible attributes with varied consequences for a customer.
For example, an automobile can be a collection of objective and subjective characteristics, such as size, color, package, comfort, price, etc., and consequences, like feelings of pride, power, prestige, and so on.
Therefore, marketers’ task is to decide how many attributes to build into the product, how much quality to include in each attribute, and how to put the attributes together to gain a competitive advantage.
But only a few product attributes are important in any actual choice process. Indeed, two or three key attributes are often sufficient to predict consumer choices. These key attributes vary by market segment and hence the marketing effort must change.
A perceptual map helps understand these key product attributes and consumer perceptions that help a firm better position its offerings.[14]
For the same reason, perceptual maps are sometimes erroneously referred to as position maps, though they are not the same. A perceptual map compares the perceived characteristics of a brand or product as seen by the customer, whereas a positioning map evaluates the actual characteristics.
To set the direction for R&D efforts
Perceptual maps can also be used to develop a formal representation of the “ideal point” of a customer, i.e., what point on the map represents the ideal combination of attributes for different customer groups.
This then can help set goals and direction for research and development to improve the next generation of products and services.
Limitations of perceptual maps
While effective in market research, perceptual maps do have some limitations that firms must account for:
- As the maps rely heavily on consumer perceptions, they may fail to reflect the actual attributes or quality of the products.
- They are subjective and may vary depending on the sample size, method, and criteria used to collect and analyse the data.
- They may not capture the dynamic nature of the market, as consumer preferences, competitors, and environmental factors can change with time. Hence the mapping exercise must be repeated periodically.
- They only consider product-related attributes and may not account for the influence of marketing variables such as promotion, distribution, and after-sales on consumer choice and satisfaction.
- Customer segments are often heterogeneous – different groups of consumers may have different perceptions and preferences for the same products. Perceptual maps may fail to accurately represent this diversity, potentially pointing to misleading conclusions when evaluating responses from mixed groups.
- It is difficult to pinpoint the optimal positioning strategy for a product using perceptual maps, as there can be trade-offs between different attributes and benefits.
- As some products may have similar or overlapping positions on the map, the tool lacks a clear basis for differentiation.
Sources
- “Perceptual mapping”. Wikipedia, https://en.wikipedia.org/wiki/Perceptual_mapping. Accessed 23 Feb 2024.
- “Analyzing Consumer Perceptions”. Robert J. Dolan (Harvard Business School), https://store.hbr.org/product/analyzing-consumer-perceptions/599110. Accessed 24 Feb 2024.
- “Perceptual Mapping: A Manager’s Guide”. Robert J. Dolan (Harvard Business School), https://www.hbs.edu/faculty/Pages/item.aspx?num=19244. Accessed 23 Feb 2024.
- “Lesson 12: Factor Analysis”. The Pennsylvania State University, https://online.stat.psu.edu/stat505/lesson/12. Accessed 24 Feb 2024.
- “Discriminant Analysis”. IBM, https://www.ibm.com/docs/en/spss-statistics/27.0.0?topic=features-discriminant-analysis. Accessed 24 Feb 2024.
- “Analysis of Multivariate Social Science Data (2nd Edition)”. University of Bristol – Centre for Multilevel Modelling, https://www.bristol.ac.uk/media-library/sites/cmm/migrated/documents/chapter3.pdf. Accessed 25 Feb 2024.
- “Consumer Involvement in Retail Store Positioning”. Raj Arora, https://journals.sagepub.com/doi/abs/10.1177/009207038201000201. Accessed 25 Feb 2024.
- “A prediction study in perceptual and evaluative mapping”. Arun K. Jain Ph.D. , https://link.springer.com/article/10.1007/BF02732314. Accessed 25 Feb 2024.
- “The Use of Nonmetric Multidimensional Scaling in Marketing Analysis”. Lester A. Neidell, https://journals.sagepub.com/doi/abs/10.1177/002224296903300407. Accessed 25 Feb 2024.
- “How advertising can position a brand”. Robert E. Smith and Robert F. Lusch, https://www.econbiz.de/Record/how-advertising-can-position-a-brand-smith-robert/10002818918. Accessed 25 Feb 2024.
- “Self-organizing map”. Wikipedia, https://en.wikipedia.org/wiki/Self-organizing_map. Accessed 27 Feb 2024.
- “Marketing and Management Models: A Guide to Understanding and using Business Models”. Yvonne Helen Strong, https://www.amazon.com/Marketing-Management-Models-Understanding-Collection/dp/1606499629. Accessed 27 Feb 2024.
- “Perceptual map: how-to, types and tools”. Awware, https://awware.co/blog/perceptual-map/. Accessed 27 Feb 2024.
- “Perceptual Mapping as a Marketing Research Tool for Brand Positioning”. Iza Gigauri, https://www.researchgate.net/publication/334089201_Perceptual_Mapping_as_a_Marketing_Research_Tool_for_Brand_Positioning. Accessed 27 Feb 2024.