Benchmarking Definition
Benchmarking is a strategy tool used to compare the performance of business processes and products with the best performances of other companies inside and outside the industry.
Benchmarking is the search for industry best practices that lead to superior performance.
What is Benchmarking
One way an organization can judge its performance is by comparing itself with other internal units or past data. However, these measurements reveal limited insights and often reinforce complacency or generate “not invented here” excuses.
Comparisons with outsiders, however, can highlight the best industry practices and promote adoption. This technique is commonly known as Benchmarking.
Benchmarking is a form of variance analysis and is the practice of comparing the performance of products, processes, and financials to that of other competitive or industry performances to understand the improvement potential or relative performance.[1]
Origin of benchmarking
The term “benchmarking” has its origins among surveyors who chiseled marks in stone to indicate levels and heights as reference points for construction calculations.
While benchmarking may seem like a management trend from the 20th century, it is not even from that era. Its origins date back to a time when man first looked at his neighbor’s hut and thought ‘That design lets in less rain than mine, perhaps I should build one like that’.

One can imagine that somewhere near the start of the road to modern civilization, men realized they could learn from each other’s discoveries and improve their own situation.
The Industrial Revolution made it clear that large profits could be made by developing better products in ways that were faster and more efficient. It also became necessary to be aware of the competition, where they stand and their future moves.
Modern benchmarking activities were established in the 1940s when governments reverse-engineered military equipment. Since then, the application of benchmarking has grown rapidly to include product/service, finance, processes, functions, strategy, and projects.
The enthusiasm for benchmarking in the 20th century was particularly fueled by two things:
- First, the Japanese development of the Total Quality Management (TQM)[4] and Kaizen[5].
These were systems for continuous improvement built on careful measurement of industrial activities and close monitoring of measures. It not only forced managers to make such measurements but also to compare with competitors and the industry. - Second, the work of Michael Porter[6] on competitive advantage forced firms to think more about their competitors and where they stood in relation to them rather than where they stood in terms of their own history.
Why organizations use benchmarking
Organizations benchmark for several reasons, the most common of which are:
As a tool to support the continuous improvement culture
Most organizations today follow continuous improvement philosophies such as TQM, the Quality Management Standard ISO9000[7], and Quality Circles[8] amongst many others. While these tools are excellent, by themselves, they do not:
- Suggest where to focus improvement activities.
- Identify appropriate performance levels, and.
- Suggest what practices are likely to lead to optimum performance levels.
Benchmarking, on the other hand, addresses these issues by answering questions such as:
- How competitive are we?
- What improvement activities should we focus on?
- Where do we stand in terms of performance in each area when compared with other organizations?
- What is the expected return on investment for improvements in each area?
- How do we prioritize improvements?
To short-cut the improvement process
Without benchmarking, organizations must expend effort on analysis, process redesign, re-training, and other costs. Even then, they may not achieve the same performance levels as others.
Benchmarking, on the other hand, helps identify current best practices, adapt and improve them and then expend effort on implementing changes with a high degree of certainty.
For target and budget-setting
Organizations often set arbitrary targets– for example, a 5%-10% improvement from current/past performance. Such targets are of little practical use.
Benchmarking helps identify specific and relevant targets based on what others are achieving. The returns on achieving such targets are often higher.
As a driver for improvement
Benchmarking against competitors is a strong driver for improvement because if an organization fails to perform at similar or superior levels to competitors, market forces will eventually force an organization out of business.
For problem-solving
Benchmarking can also be used to solve specific problems. Looking at others carrying out similar work reveals what processes, tools, or equipment they use and the problems they encounter.
As a mandate of Business Excellence Models
Many excellence models including the Baldridge Award in the USA[9], and the European Foundation for Quality Management Excellence Award in Europe[10] among others require or at least imply the need for benchmarking.
To target a competitor’s weak points
Though not common, some organizations use benchmarking to find a competitor’s relative weak points as perceived by customers. This helps them to ensure that their own performance remains better in those areas or markets, thus providing a competitive edge.
Types of benchmarking methods
Several benchmarking methods exist. Organizations can either choose any one method suited to their needs or use a mix of methods to achieve the best results.
Seven of the most commonly used benchmarking methods are outlined and explained:
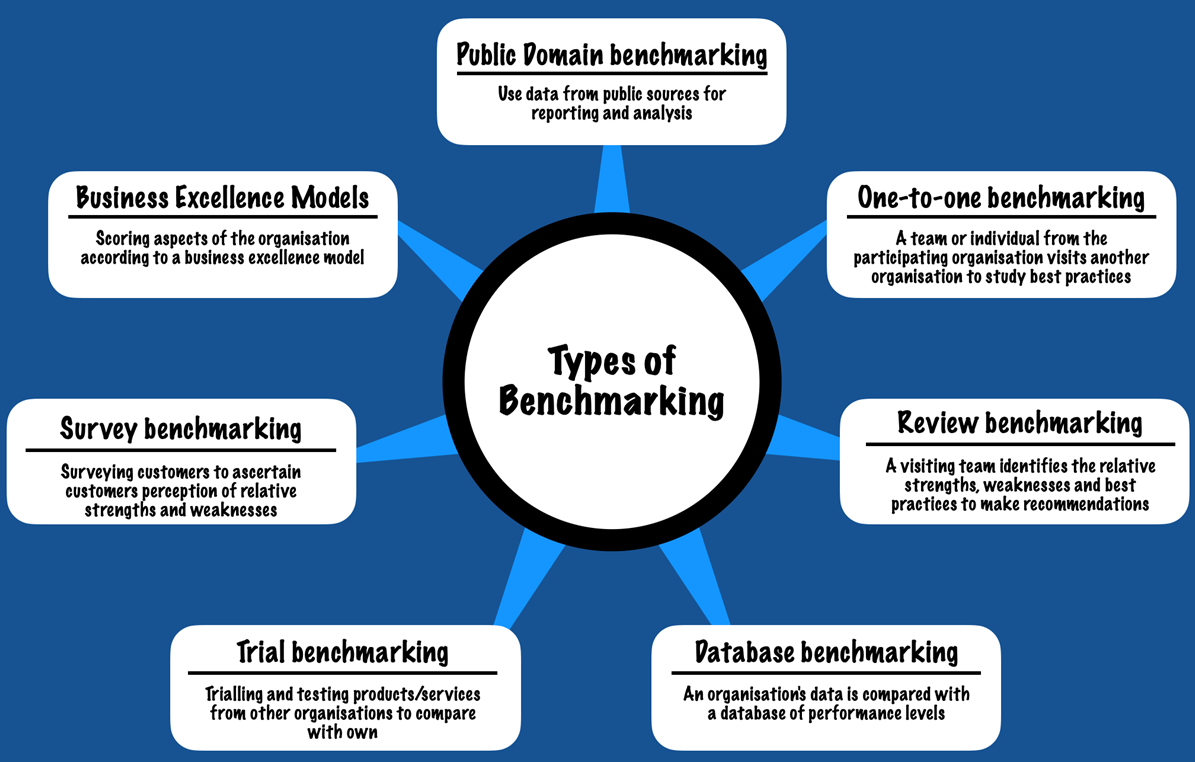
Public Domain Benchmarking (PDB)
Concept
In this method, the benchmarker collects data from public sources for analysis and reporting. The metrics used are usually ‘output’ metrics – the ones that measure product/service in terms of customer experience.
For example, when comparing cars, metrics used are likely to include selling price, brand perception, features, safety rating, reliability etc. Metrics important to internal business, such as employee satisfaction, manufacturing throughput, distribution, etc., are excluded.
Example
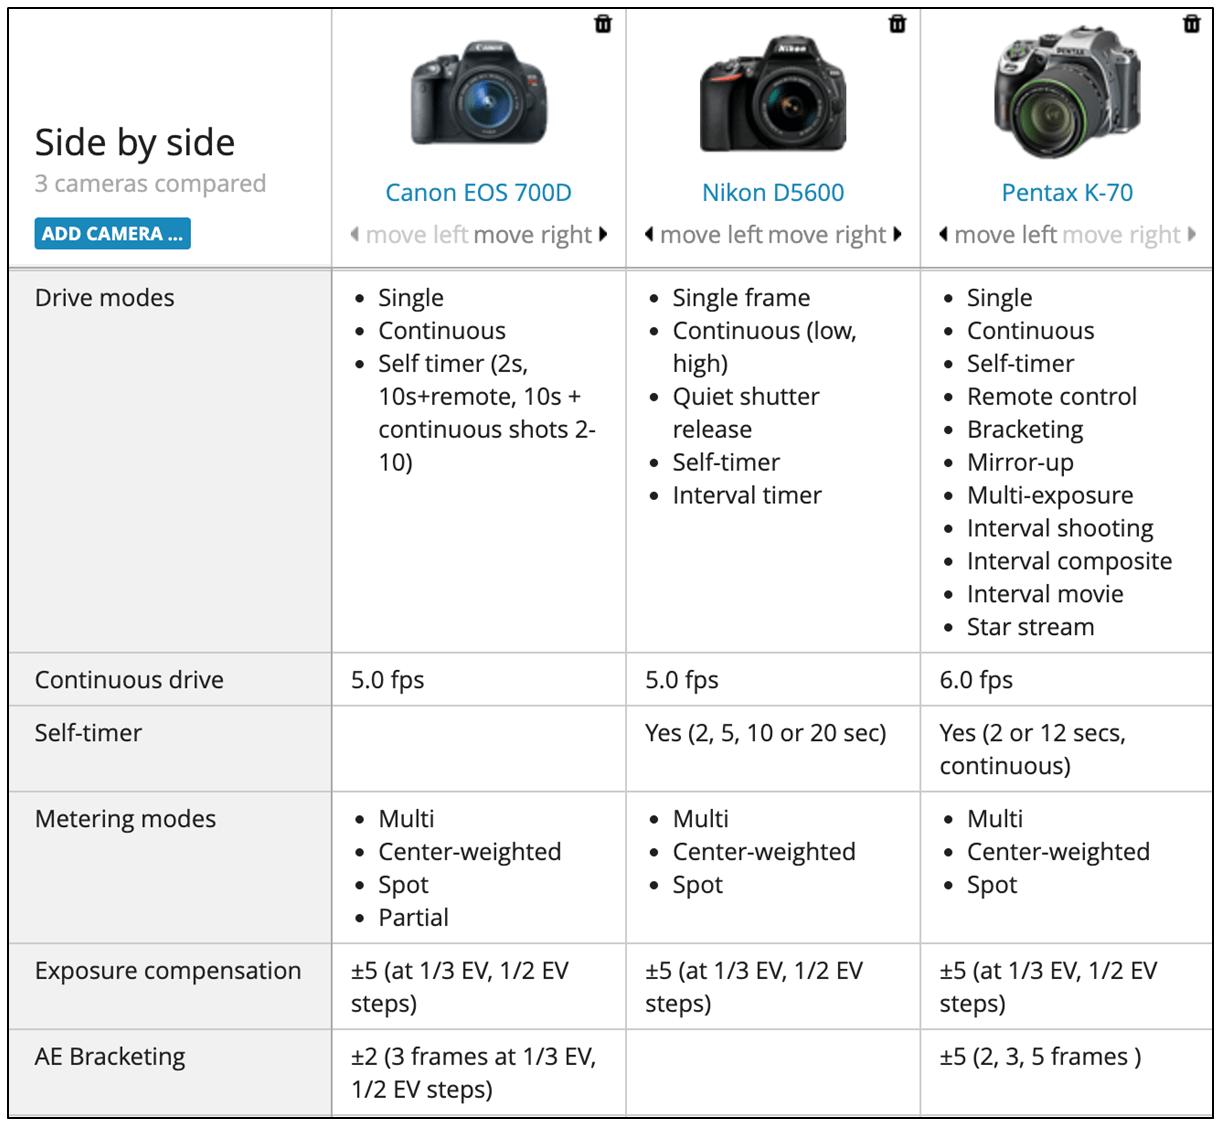
The most common and visible example of this type of benchmarking can be seen in hobby and consumer websites which provide independent reviews of a host of products and services ranging from cars to cameras to credit cards.
Some websites also survey their subscribers to compare the customer experiences of products and services. PDB is also a preferred choice to benchmark public services such as schools (by passing rates), hospitals (waiting times), fire services (response time), transportation (timing, comfort) etc.
Participants
The participants in PDB are generally unaware that they are part of the study till the results are published. Their selection is controlled by the benchmarker and they usually do not influence membership.
Control of the Study
In a PDB, all aspects of the study are controlled by the benchmarker. While participants might be requested to supply products (e.g.: a demo car), refusal generally implies that the participant believes their product/service will fare badly in the study.
In most cases, data for benchmarking is required to be reported by law or is available in the public domain. There is seldom a need to seek any further information.
Risks
In a PDB, the risks for each of the three groups that have an interest in the process are as follows:
- Benchmarker: The organization carrying out the study (benchmarker) has a very low risk, generally limited to a lawsuit that may result if they are unable to substantiate published findings.
- Customers: Customers dependent on the benchmarking studies face the potential risk of incomplete or inaccurate analysis leading to dubious conclusions or the omission of potential participants from the study. Hence, caution must be exercised when interpreting data.
Customers may also face the risk of participants manipulating their processes in order to improve their position.
Another disadvantage is that when comparing products, often only one sample from each participant is benchmarked which may not accurately reflect parameters such as reliability. - Participants: Participants’ risk is limited to the study showing them as a poor performer which may affect their image.
Timeline
The timeline of a PDB study can vary from a few days, where data are already in the public domain and only need to be extracted, formatted, and reported, to several months, where extended trials or tests are necessary.
Use Case
PDB is useful to provide information to the public that helps make informed decisions about products and services they use. Willing or unwilling, benchmarking participants will also have access to valuable information regarding how their products and services relate to others in the marketplace.
While a favorable report helps participants market their services and products better, those who come out poorly can use the information to drive improvement within the organization.
The PDB Process flow
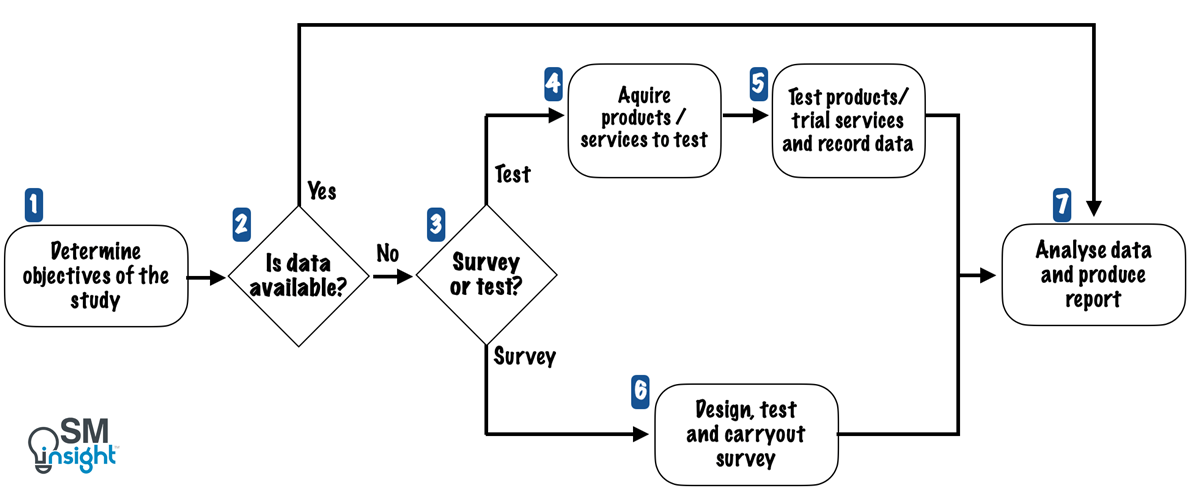
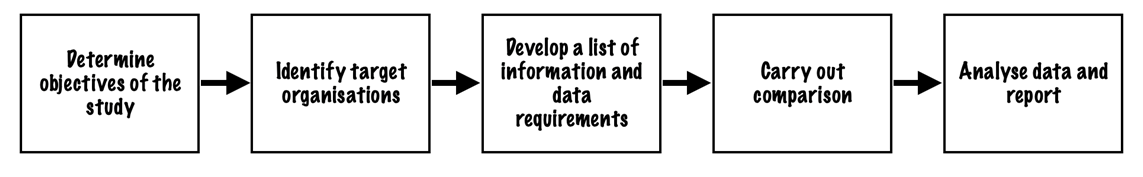
While every benchmarker may have their own detailed process, the overall PDB process follows the following seven steps:
- Determining objectives and scope of the study: usually, the primary objective is to determine the best product or service from the customer’s viewpoint. A second objective is to comment on favorable and unfavorable aspects of the products or services reviewed. PDB is also used to highlight the disparity in public services such as medical services, schools, or policing.
- Check if data exists: If the data is already available (such as government sources, the internet, or other published material), the benchmarker can acquire the data and move to Step 7.
- Decide how to obtain data: Data can typically be obtained from a test or a survey. Testing involves experiencing the product or service first-hand and reporting on the findings while a survey relies on past users for the same information. Combining both approaches is a good way to corroborate test results with the survey findings.
- Acquire products: A product or service may be acquired either as a member of the public without revealing intent or by asking the participant to supply samples for testing. The latter has the advantage of lower cost but carries the risk of manipulation.
- Testing: the nature and extent of tests can vary widely, from simple reporting to taking measurements and extended field trials over time. The benchmarker may carry out tests themself and/or may invite members of the public to trial and provide feedback.
- Survey: carrying out a survey reliably can be a complex process. It is advisable to appoint specialist survey organizations/individuals with experience in the process.
- Analysis: the complexity of analyses will depend on the objectives of the study and the quantity and type of data collected. Most reports include the objectives of the study, how it was carried out, and the source of the data while identifying performance levels.
One-to-One Benchmarking (OTOB)
Concept
Originally developed by Xerox in the 1970s and 1980s, OTOB is the most widely used benchmarking method and consists of the following steps:
- Finding out which organization is the best, or amongst the best, at performing the aspect of business that is the target of the improvement.
- Visiting them to ascertain their level of performance and learn how they achieve that performance.
- Studying their best practices, modifying them where necessary, and improving them where possible.
- Adopting the new practice into one’s own organization.
While it is not necessary, or usually possible, to ensure that the target participant is the best, it is enough to know that the target participant is performing significantly better and that it is amongst the best in the area being benchmarked.
Example
In the 1990s, Xerox Corp, the maker of high-technology copiers, took inspiration from L.L. Bean Inc., a retail firm with a reputation for delivering sweaters at the industry’s best speeds.
When Xerox went through their processes, it discovered that L.L. Bean could pick and pack goods three and a half times faster. Xerox later developed its own distribution system for copiers based on learnings from L.L. Bean and significantly improved deliveries.
While copiers had no similarity with sweaters, it was because Xerox believed that L.L. Bean was amongst the best at distribution that they visited them to learn about distribution processes. It might also be possible that L.L. Bean’s other processes, such as billing, purchasing, and order tracking may not have been better than Xerox’s.
In OTOB, the key is to determine what the target organization excels at and learn about that aspect of their business.
Participants
OTOB has two participating organizations:
- The initiator – the organization initiating the benchmarking study.
- The target – the organization with which the initiator wants to benchmark and is perceived as high-performing in terms of the scope being benchmarked.
An OTOB initiator may also perform a series of paired benchmarking studies, both within and across industries and geographies. This provides several best practices for review and comparison before implementation.
Control of the Study
OTOB is controlled by the two participants who mutually agree on timescales, information to be exchanged, modalities and other legal and logistical aspects of the study.
Risks
OTOP presents some unique risks:
- Improper information – because only one or two representatives visit during the benchmarking, the information fed back to the initiator’s management may be incomplete, subjective, or anecdotal.
Common reasons include a lack of a structured method for information collection and a fear of reporting how poor conditions are to one’s own management. - Inaction – benchmarking visits that are not followed up with actions end up being seen as expensive trips for a privileged few.
- Implementing changes without considering relevance – a practice that helped a target participant may not always be relevant to the initiator.
For example, a mass-market automobile manufacturer may be able to maintain lower inventory levels due to standardization while a luxury manufacturer may find the same practice to be logistically complex and expensive.
While OTOB has some risks, on the positive side, the associated costs are relatively lower due to comparatively less manpower and effort required to complete the study. It also offers high learning potential as cross-industry benchmarking makes it possible to identify quantum differences in performance levels.
Timeline
OTOB studies are usually very quick to complete once a target organization has been identified. Depending on the scope and complexities, site visits can range between one day to several days.
Use case
OTOB is most suited to cases where the initiating participant knows what they want to learn and from whom they want to learn it. It is also a natural step following other benchmarking studies – for example, a PDB study may reveal poor performance as well as potential candidates for OTOB.
The OTOB Process flow
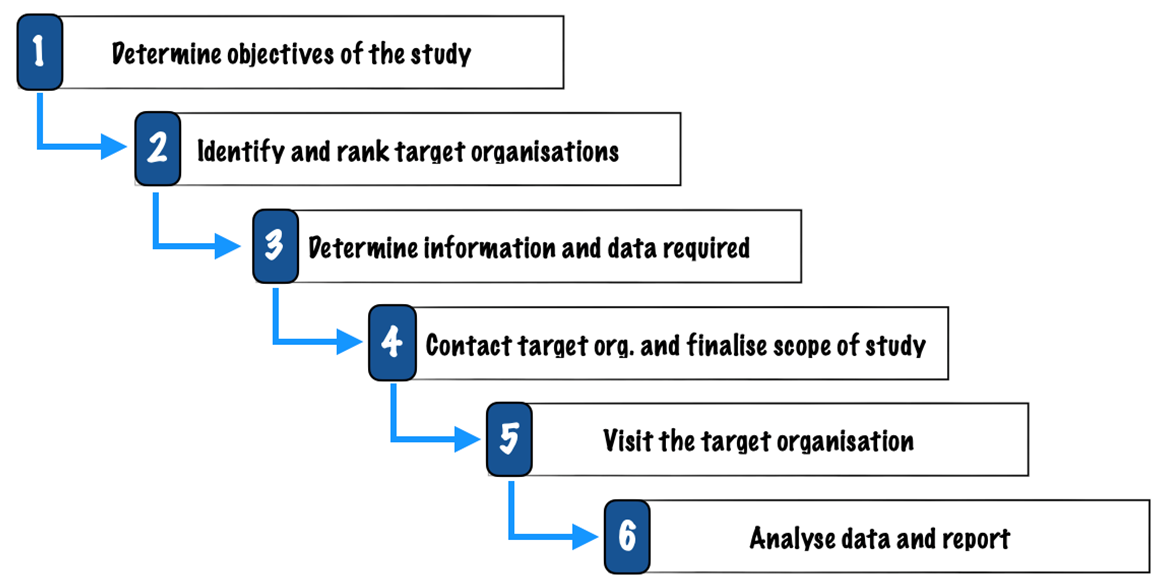
Typical steps in an OTOB study are:
- Determine objectives: This step typically includes identifying best practices that lead to superior performance in the area being benchmarked.
If the target organization is known to be a significantly better performer, the process of gathering necessary data to demonstrate its superior performance can be skipped. Alternatively, it may only be necessary to make a rough approximation of the performance level in the case of one (or a few) participants. - Identify and rank potential target organizations: In some cases, the potential target organizations may be obvious. For example, pit stops in Formula 1 racing have been the gold standard of synergy and efficiency and have inspired many industries.[13]
In other cases, a participant can use a number of criteria to identify potential targets including perceived performance level, perceived similarity of benchmarking subject, commercial considerations, and location. - Determine information and data requirements: Involves documenting specifics of what is to be learned and the information required from the target organization. The initiating organization must have a deep understanding of their own processes and weaknesses to complete this step.
- Contact the target organization and finalize the scope: This step involves contacting and sharing expectations from the visit along with data so that appropriate people can be appointed to answer questions and to ensure they have any data, demonstrations, documents, etc. prepared for the visit.
- Visit the target organization: A well-prepared visit provides the required information. It is important to adhere to codes of conduct and respect the decision of the target participant to withhold information or data.
- Analysis and reporting: In this step, the initiating participant prepares a report outlining what information was shared, conclusions, and recommendations for further action. The target organization may also request a copy of the report or at least the parts relating to it.
Review Benchmarking
Concept
In a review benchmarking study, a person or group visits a number of participants with the intent of reviewing certain activities at each facility to compare findings. The review may involve data comparison, working practices or a combination of both.
Objectives typically include:
- Identifying the performance levels of each participant
- Quantifying performance gaps between each participant, the best performer and/or the group’s average
- Identifying differences in working practices that lead to differences in performance
- Recommending a course of action for each participant to improve performance
While most review benchmarking studies are performed by participants who initiate the study for their own benefit, some organizations, such as Best Practices LLC[14], carry out research to discover best practices with the aim of publishing and selling their findings.
Example
A processing plant owned by a Joint Venture (JV) for example may benchmark its efficiency by comparing its work processes to several other similar plants owned by JV partners. The resulting report will highlight the plant’s performance gaps, potential benefits from matching the best performer, and recommended actions.
Participants, Control of Study and Risks
Any group of organizations, within or across industries, may agree to take part in a review benchmarking study as participants. While a two-participant becomes similar to an OTOB, as the number of participants increases, the study demands more careful planning and control.
Typically, such a study is controlled equally by all participants, but It is also possible that the group of participants agree to the objectives of the study and leave the details to one.
Review benchmarking study has low risks as participants have total control and can specify all the aspects of the study including other participants, use of a consultant, metrics, processes, etc. However, associated costs can be high depending on how the study is run.
Timeline
Review benchmarking studies are typically carried out in more depth compared to OTOB and include both, the collection of data and documenting the working practices along with a comparison. Depending on the number of participants and the depth of the study, it usually takes a couple of weeks to a few months.
Use case
Review benchmarking studies are best suited when the group of participants is small and they want to benchmark areas where differences in performance level are due to subtle operational differences. This normally requires an in-depth understanding of aspects such as commercial, legal, or engineering issues that will not be readily identifiable from data alone.
Because review benchmarking is relatively expensive, its use is limited to cases where there are large differences in performance levels which poorer performers can exploit to benefit significantly.
The review benchmarking Process flow
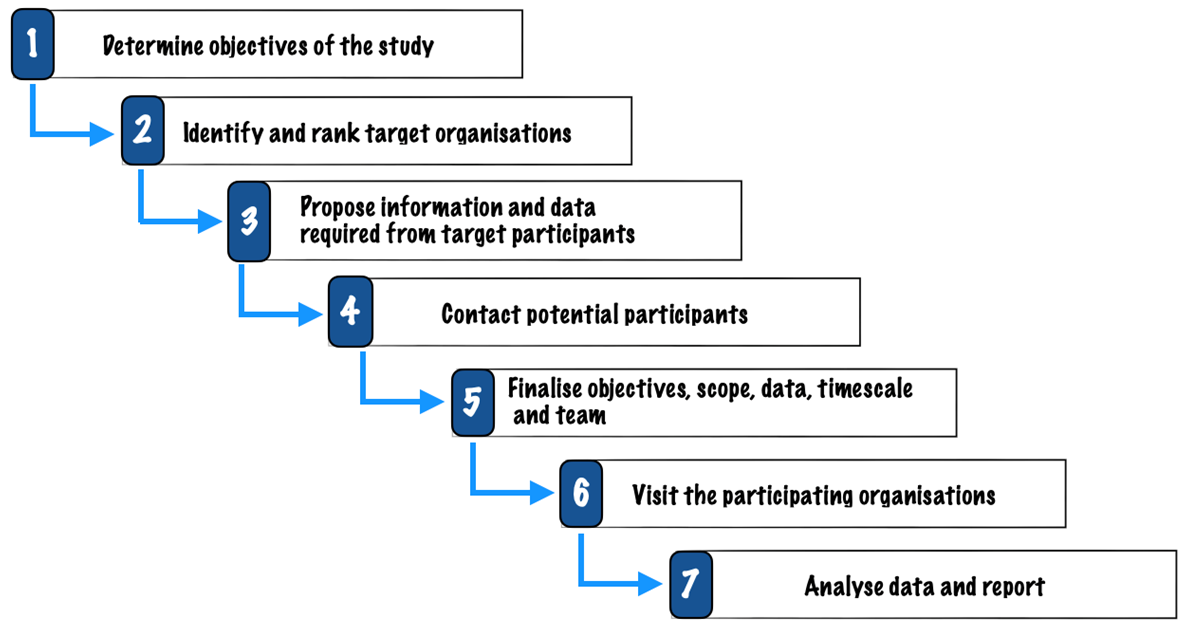
The review benchmarking process is similar to OTOB and consists of the following steps:
- Determine scope and objectives: initiating participant(s) determine the objectives of the study which include ascertaining relative performance levels, quantifying the potential benefit of performing at the level of the best performer and identifying best practices.
- Identity potential participants: recognizing and prioritizing participants who are preferred candidates for the study. If the study is initiated due to prior benchmarking, is an internal investigation, or involves organizations with pre-existing connections, it is likely that the participants are already identified.
- Draw a list of information and data requirements as potential participants will expect to know what is being proposed.
- Contact potential participants – inviting them to take part in the study.
- Finalize plan: review the details of the study through a series of meetings to ensure everyone understands its scope, nature, and benefits. Data confidentiality concerns, if any, are also discussed (this might limit the participation).
- Complete visits – the benchmarking team visits the participants to collect data and information, and to ensure it is properly understood.
- Analyze and report: Visit findings are written up and issued as per agreement. It is a good practice to issue a draft report that allows participants to correct any inaccuracies and/or add further appropriate information.
Database Benchmarking
Concept
Database benchmarking is used in situations where a benchmarker, usually an independent consultant, has a built-up database of performance levels from many organizations over time. As each participant joins the study, their data is added to the master database and performance is compared to that of other participants.
Example
Database benchmarking is often offered by consulting firms that maintain a database of several benchmarking studies. While some are open for public use, others are only open to members. For example, McKinsey & Company has a tool known as Portfolio Navigator that helps banks compare their performance against industry peers.[15]
Participants, Control of Study and Risks
The number and types of participants can widely vary in a database benchmarking study. While participants may be given a complete or partial list of other participants, their performance levels are unlikely to be divulged.
Control solely lies with the consulting organization (database owner) which controls most aspects of the study. Participants have little to no influence over the data collected, data definitions, or metrics calculated by the consultant.
Hence, participants are exposed to the risk of poor benchmarking quality as the results are largely dependent on the integrity of the consultant and the accuracy of the supplied data.
Timeline
The timeline depends on the speed with which the data can be supplied and the consultant’s internal processes – typically taking a few weeks. Some online studies even provide results instantly upon providing the data.
Use case
Database benchmarking is a go-to option when a reputable consultant is known to have a database of high-quality data along with a successful track record in helping organizations improve.
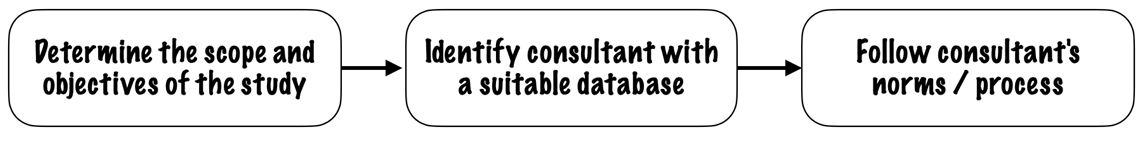
Database benchmarking Process flow
The process is straightforward, with the third step depending on the chosen consultant’s internal processes:
Trial Benchmarking
Concept
Trial benchmarking is similar to PDB, but with the exception that the initiating organization itself carries out the benchmarking. As the initiator simply uses the services or products to be benchmarked, other participants are unaware that they are being benchmarked.
Examples
Airlines frequently benchmark their customer experience by flying with other airlines to evaluate aspects such as quality of food, friendliness of staff, seat comfort etc. Online websites are frequently compared with competitor websites to benchmark speed, design, responsiveness, ease of use etc.
Participants, Control of Study and Risks
Participants are usually the initiating firm’s competitors and are unlikely to know that they are being studied. The initiating firm controls all aspects of the study and there are very few risks associated with this type of benchmarking.
Timeline
The timeline can vary widely depending on the product or service being studied. For example, evaluating the durability of paint may require several months or even years, whereas assessing an airline experience can be accomplished in just one or a few visits.
Use case
Trial benchmarking is best suited to
- Monitor competitor performance and identify potential product/service improvements.
- Identify potential participants for a detailed benchmarking study.
- Identify a firm’s own areas of high performance and market them as strengths.
Trial benchmarking process flow
Trial benchmarking consists of a five-step process:
- Determine scope and objectives – define the features & performance parameters of products and/or services to be benchmarked, which may include quantifying the costs and benefits of improving the product and/or service.
- Identify target organizations and rank them in the order of preference for the study. While the potential participants for competitor benchmarking are obvious, non-competitor benchmarking studies (e.g., online ordering processing) will require some research.
- Develop a list of information and data requirements.
- Carry out comparison – acquire/experience products and/or services as planned.
- Analyze and report the findings of the comparisons and document as required.
Survey Benchmarking
Concept
Like trial benchmarking, survey benchmarking is also a subset of PDB, and is more commonly used in the consumer goods and services market where a customer’s perception is the key to a supplier’s success.
Carrying out a customer survey is often the most direct way to gain insights into customer perception and is usually performed through interviews, web, telephone or email.
Example
E-commerce websites frequently email guests with a survey questionnaire asking them to rate their purchase experience.
Participants, Control of Study and Risks
In a survey benchmarking, the initiating organization chooses whom to benchmark against and has good control over the study. Other participants are unlikely to know that they are being benchmarked.
While there are very few associated risks with survey benchmarking, the effectiveness of the process hinges on designing and administering effective customer surveys and interpreting the results which may require statistical expertise.
Timeline
A one-off study with the involvement of a survey consultancy could take up to several months. However, eliciting feedback from customers is a continuous process that most organizations carry out regularly.
Use case
Survey benchmarking is typically used to:
- Monitor customer perception about competitor performance.
- Identify potential product/service improvements.
- Identify potential participants for a detailed benchmarking study.
- Identify a firm’s strengths and build markets for those strengths.
Survey benchmarking process flow
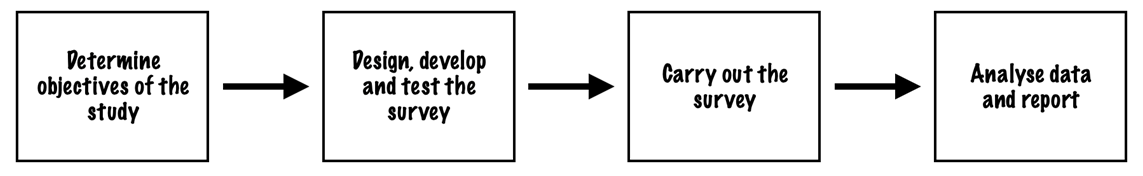
Survey benchmarking generally has four steps:
- Determine scope and objectives: usually limited to ascertaining the strengths and weaknesses of competitor products and services. However, the survey could be used to gather additional information such as complaints, improvements, and new products/services.
- Design, develop, and pilot test survey – involves developing a questionnaire and selecting its method of delivery (e.g., email, post, telephone) along with other specifics such as size, sampling method, and other survey details. This is followed by pilot-testing the survey to ensure that the results produce the required information.
- Carryout the survey
- Analyze and report
Business Excellence Models
Concept
A Business Excellence Model (BEM) is a set of interrelated criteria that aims to capture
key aspects of a successful organization. The model is designed such that the extent to which an organization adheres to these criteria reflects its success.
BEMs provide a mechanism for comparing the performance of any group of organizations by scoring each one against a standard and comparing the scores. In BEM benchmarking, a direct comparison between organizations is seldom, if ever, carried out.
Most commonly used BEMs include the Malcolm Baldridge Award Model[9], which is used in over 25+ countries and the European Foundation for Quality Management[10] which is used across Europe.
All Excellence Models work on similar principles by defining criteria that they believe, if effectively implemented, will lead an organization to operate at world-class standards. For example, the Malcolm Baldridge Award Model defines seven criteria as critical to the success of any business:
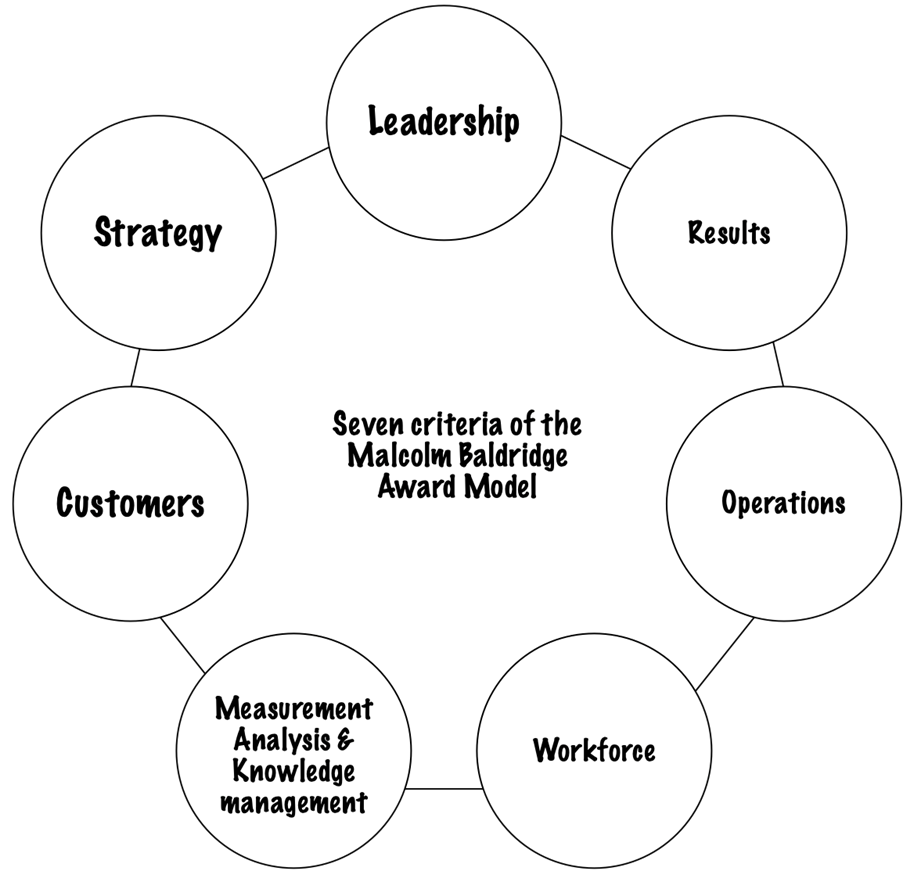
Although BEMs were not intended to be used for benchmarking, some or all of the model’s criteria can be used as metrics for comparison.
Examples
Organizations that use BEM for benchmarking generally do not publish the findings. Hence, examples are difficult to identify.
Notably, From 1998 to mid-2003, Caterpillar Financial Services Corporation U.S. used the Baldrige process to increase its assets by 34 percent and profit by 54 percent, while industry performance declined by 21 percent and 35 percent, respectively during the same period.[17]
Participants, Control of Study and Risks
Unless participants agree to share assessment information and learning, there is only one participant – the one being assessed. That organization is also the one in control of the study unless a consultant or an awarding body carries out the assessment.
There are no real risks in entering excellence awards except usually a fee and the time required to gather the information and make a submission.
Timeline
The timeline depends on the size of the organization and the availability of data and information, typically ranging from a few weeks to months.
Use case
BEMs are a good method to review all of the organization’s activities and identify weak areas with the added benefit of good publicity if the organization does well.
Choosing a Benchmarking Method
While clarity emerges as an organization prepares for its benchmarking projects, the most appropriate method depends on a number of factors, including:
- Confidentiality requirements (the extent to which data can be shared openly, shared but anonymized or not shared).
- Whether the participant knows which organization(s) are the best performers or whether comparative levels of performance need to be ascertained.
- The scope of the study.
- Whether a benchmarking club similar in scope already exists.
- The organization’s experience level in benchmarking.
Each of the above factors can be addressed in a wide variety of ways and the benchmarking study can be tailored to meet the needs and constraints of the participants.
Types of benchmarking projects
The first step in a benchmarking study is to select a benchmarking project. While there are no globally accepted definitions or classifications of a benchmarking project, based on the focus area and the scope, they can be broadly classified into the following:
Process Benchmarking
These are benchmarking studies where partial or complete processes are benchmarked.
For example, an organization may choose to benchmark its entire purchase process. Alternatively, within the purchasing process, it might focus only on the process from issuing a purchase order to the arrival of goods on-site.
Process benchmarking can include various locations, facilities, and groups and allows for in-depth examination.
Process benchmarking need not be confined to any specific industry as many support processes, like purchasing, warehousing, and billing, are not industry-specific. While cross-industry process benchmarking is usually more difficult, it is also where the greatest learning opportunities exist.
Facility Benchmarking
Some studies benchmark self-contained facilities such as factories, power plants, or airports. Such studies are typically suited to analyze the comparative total cost and/or hours required to produce a unit of output.
It is also used in situations where it is not possible to split the scope based on tasks or groups.
A facility benchmarking typically covers the whole facility and requires looking at many different activities. Thus, it provides a good overview of where strengths and weaknesses lie and helps management decide which areas to focus improvement activities on.
Studying a complete facility or group in depth can be a highly complex project and is often simplified by:
- Benchmarking activities at a high level.
- Initiating separate studies for selected areas.
- Limiting the scope of the study.
Facility benchmarking is not suited to small facilities where the same individual may be involved in several tasks or may have multiple roles and responsibilities.
Product and service benchmarking
This kind of benchmarking focuses on the output of the process as experienced by the customer – usually a product or a service or sometimes a combination of both. IT help desks, after-sales, domestic goods, cars etc., are typical examples.
A key advantage of product and service benchmarking is that it provides critical information on how the customer experiences the product or service.
However, as the focus is only on the final output, such a study provides limited opportunities for learning about practices that produce better products or services.
Activity Benchmarking
Activity benchmarking focuses on individual-specific activities or tasks and is used as a part of other types of benchmarking. It is generally limited in scope and goes into great detail.
Functional Benchmarking
In functional benchmarking, the subject of the study is not a whole facility, nor necessarily a whole process but a specific function, group or subject that may extend over several sites and/or several departments. For example, finance or warehousing.
Generic Benchmarking
Generic benchmarking is the process of analyzing two companies in different industries while focusing on a general required result and the process to achieve it.
Such benchmarking studies seldom compare performance with others by using metrics; rather, they investigate how other industries successfully manage the key aspects of their business.
For example, the perfect Formula 1 pit stop takes less than 2 seconds and has inspired industrial applications ranging from patient safety to toothpaste production.[18]
While the gains are spectacular if successful, generic benchmarking is perceived as being difficult as it demands a leap from the obvious route of comparing and learning from others.
Project benchmarking
Project benchmarking is the benchmarking of stand-alone events or projects such as construction projects. It is not as common as other types of benchmarking, as no two projects are the same and, therefore, cannot be easily benchmarked.
Participants in such a study search for projects similar to the one being planned and use benchmarked data to help determine likely costs, resource requirements, typical problems and solutions.
Project benchmarking is also different from other types of benchmarking in that the data reported will reflect a complete project rather than a period.
Choosing a benchmarking project
Most benchmarking studies begin with a chosen subject, but if not, the selection process is made up of two aspects:
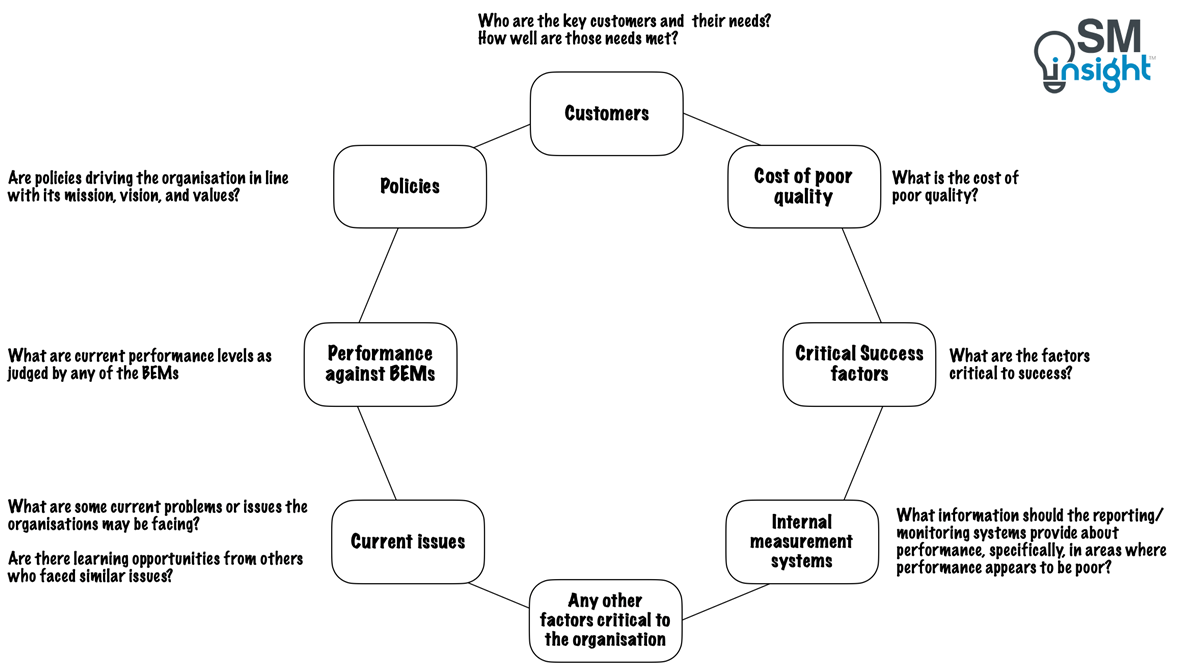
Identifying a list of potential benchmarking projects
To generate a list of potential benchmarking projects, an organization can consider the following:
Selecting which project(s) to progress
The following considerations are useful in narrowing the list and selecting benchmarking projects:
- The benchmarking experience of those who will be involved in the project. The selected benchmarking project must be easy to complete with a high probability of success.
Once the organization in general, and those who will be involved in benchmarking in particular, have gained experience in benchmarking, more complex issues can be benchmarked. - Key success factors – preferred areas for benchmarking are those that are key to the success of the business and where performance is believed to be poor.
- Stakeholder support – It is crucial that the gains expected from the benchmarking study attract support from management and potential participants. Key people in the area being studied must also be supportive of the project, or else it could lead to non-cooperative behaviour that undermines the success of the study.
The benchmarking process
An organization’s benchmarking processes can vary based on its needs and situations. Organizations that have no existing benchmarking processes can follow the following model which is split into three phases:
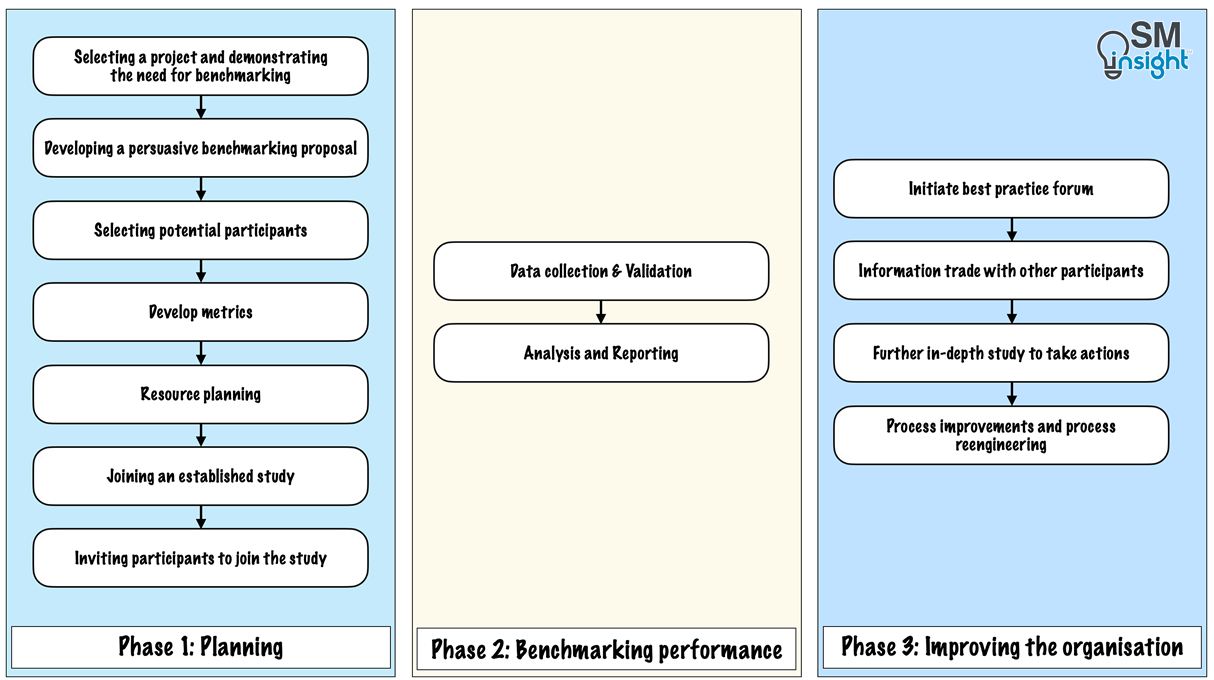
Organizations where a benchmarking study already exists and meets most of the needs can join the existing study rather than attempt to set up a new one. In such a situation, the activities in Phase 1 will reduce significantly.
Each of the stages in the above three phases is discussed in more detail:
Phase 1: Planning
Selecting a project and demonstrating the need for benchmarking
Organizations will not allocate significant resources to a benchmarking project unless they believe that it will bring significant benefits. As benchmarking is used to identify areas of weakness, in organizations that have no apparent weakness, management may be reluctant to commit resources.
Hence, the first step is to identify the need and persuade decision-makers about the benefits of benchmarking. This can be accomplished by including references to:
- The current performance level of the organization.
- Why the current performance level is not acceptable?
- Why is it important to know the comparative performance levels vs competition.
It is important for statements to be factual and should not imply a solution or blame.
Developing a Persuasive Benchmarking Proposal
The next step in a benchmarking study is to develop or review the project charter which typically includes the scope of the study, business reason for the study, project objectives and team members as a minimum.
Justification for the study must be based on the weakness already identified and should include potential benefits. The potential benefits must be attractive enough to gain management support.
It is also important to identify the objectives that define what the study will achieve. These objectives ultimately act as a yardstick against which the success of the study is measured.
The three parts of the Charter: scope, justification, and objectives, have key roles to play throughout the study:
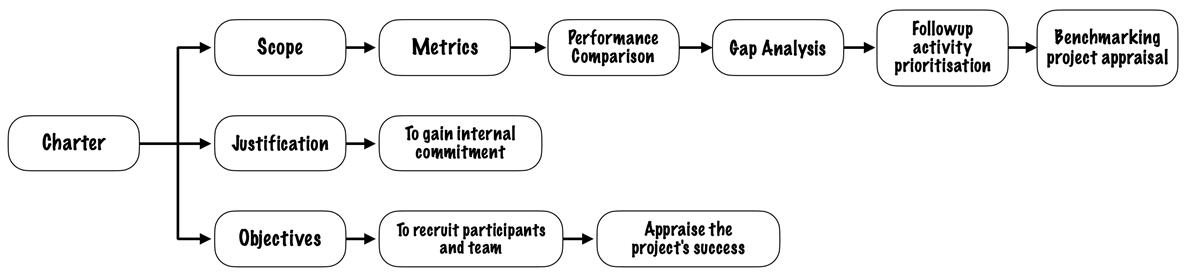
After finalizing the Charter, the team can create a project proposal that aligns with the Charter’s objectives.
This proposal is a vital component of the study, serving multiple needs from gaining management support to acting as a communication tool within the organization, aiding in recruiting participants, guiding the team throughout the project, and ultimately serving as the benchmark for evaluating the project’s success.
Selecting Potential Participants
Deciding who to invite to join a benchmarking study is both a difficult and important decision. The process of selecting participants involves developing a list of preferred participants ranked in the order of preference along with reasons for choice.
Typical attributes of preferred benchmarking participants include:
- World-class performers in the targeted aspects so that learning can be maximized.
- Industry peers with similar commercial environments, structures, performance metrics, and other aspects so that identifying and adopting best practices is easier.
- Those located nearby for ease of communication.
Benchmarking participants can be classified as:
- Internal – groups within the organization. This can lead to being the best in the organization.
- Competitors – who operate in the same industry. This can lead to increased market share.
- Non-competitors – within the same industry but not competing for the same market share (For example, Honda and Rolls Royce). Such benchmarking can lead to being the best in the industry.
- Cross-industry – organizations from different industries and thus non-competitors (earlier example of Xerox and L.L. Bean Inc). The organization can potentially become the being the best in the world.
Develop Metrics
Metrics enable measurement and comparison of performances between participants and quantifies performance gaps and potential gains. Management and potential participants see metrics as a key element of benchmarking study.

Clear definitions are important in developing metrics without which, participants may report to different standards. Once the metrics are finalized, the data is collected, validated, and analyzed. This is followed by a gap analysis between each participant and a selected standard (such as ‘best in class’, top quartile, or average).
The resulting recommendations are then provided to drive actions.
While metrics are important, they are not always necessary to complete a successful benchmarking study. Generic benchmarking for example, which identifies a completely new approach to running aspects of the organization does not use metrics for comparison.
Resource Planning
The final aspect of the planning stage is to determine the resource requirements and timescale for the study. This results in a persuasive proposal to management to support the benchmarking project and release the required resources.
The resource requirement and timescale will depend on many factors, such as:
- Scope of the study – the wider the scope, the more effort to benchmark it.
- The planned number of participants – a greater number of participants leads to slower decision-making and accommodating the needs of all participants becomes increasingly challenging.
- The ease with which participants can be persuaded to join the study – the more difficult it is the more resources will be required to recruit them.
- Proximity of participants – wider the spread of the participants, the greater the travel time, and, for international studies, the more difficult it is to cater for differences in aspects such as culture, cost structures, and exchange rates.
- The complexity of data requirements and analysis – the more complex the data requirement the more care is required with data definitions, development of data collection packs, analysis, and reporting.
- Anonymizing information – anonymizing info such as costs will require more effort than sharing it openly.
- Team member’s experience – the greater the experience the less time is required to complete the study.
- Need for external resources – the use of external resources (such as consultants or facilitators) brings valuable experience but is likely to be expensive.
Joining an established study
Having defined the scope and objectives of the study, organizations must search for studies
already in existence that would fulfill their need.
The key advantage of joining a well-run study is the availability of well-defined, honed, and effective metrics, along with a variety of participants committed to benchmarking.
Such participants may have already identified and implemented best practices that create a positive atmosphere of learning and improvement.
Gaining management approval
As multiple projects compete for the same funding and resources, a benchmarking study must demonstrate not only monetary gains over costs but also greater benefits when compared with other projects.
A complete review of the proposal before inviting management and other participants is a good step to ensure that the proposal is well thought out, complete and enticing. This increases the likelihood of its acceptance.
Inviting Participants to Join the Study
Once the project has been approved, the next step is to invite participants to join the study. It is easier to recruit internal participants as managerial influence can be used to encourage participation.
While it is a good practice to involve participant organizations early on, new potential participants can always be invited at any stage in the process.
Phase 2: Benchmarking Performance
The second major phase of the benchmarking study begins when potential participants work together to finalize and implement the study. This phase is usually flagged off with a kick-off meeting, where the focus is on building relationships and discussing the overall aims and objectives of running the project.
Data Collection and Validation
By this stage, the participants will have agreed on what data to collect and will have developed definitions. The next step is to determine how best to capture the data.
A good approach is to design a data collection pack made of spreadsheets and/or a questionnaire for each participant to complete and return for validation and analysis. Other collection methods include hard copy forms, data-gathering visits and/or web interfaces.
Once the data is collected, the next step is to validate by resolving any omitted items, apparent inconsistencies, or seemingly spurious values.
Analysis and reporting
The amount and depth of analysis and subsequent reporting varies greatly depending on the terms of the study.
In some studies, there may be a minimum of analysis (e.g.: magazines that review products and services), while in other studies, analysis could include, for example, performance level comparison, performance gap analysis, testing of theories, recommendations for improvement etc.
Phase 3: Improving the organization
The improvement stage begins once the participants have received the report or other study deliverables that help identify where and how to improve. This is the stage where the returns are realized.
There are many ways in which participants may choose to drive improvement, including:
- Initiating best practice forums.
- Taking part in information trades with one or more other participants.
- Carrying our further in-depth studies before taking improvement action.
- Implementing internal activities such as process improvement and process reengineering.
Data analysis & presentation tools
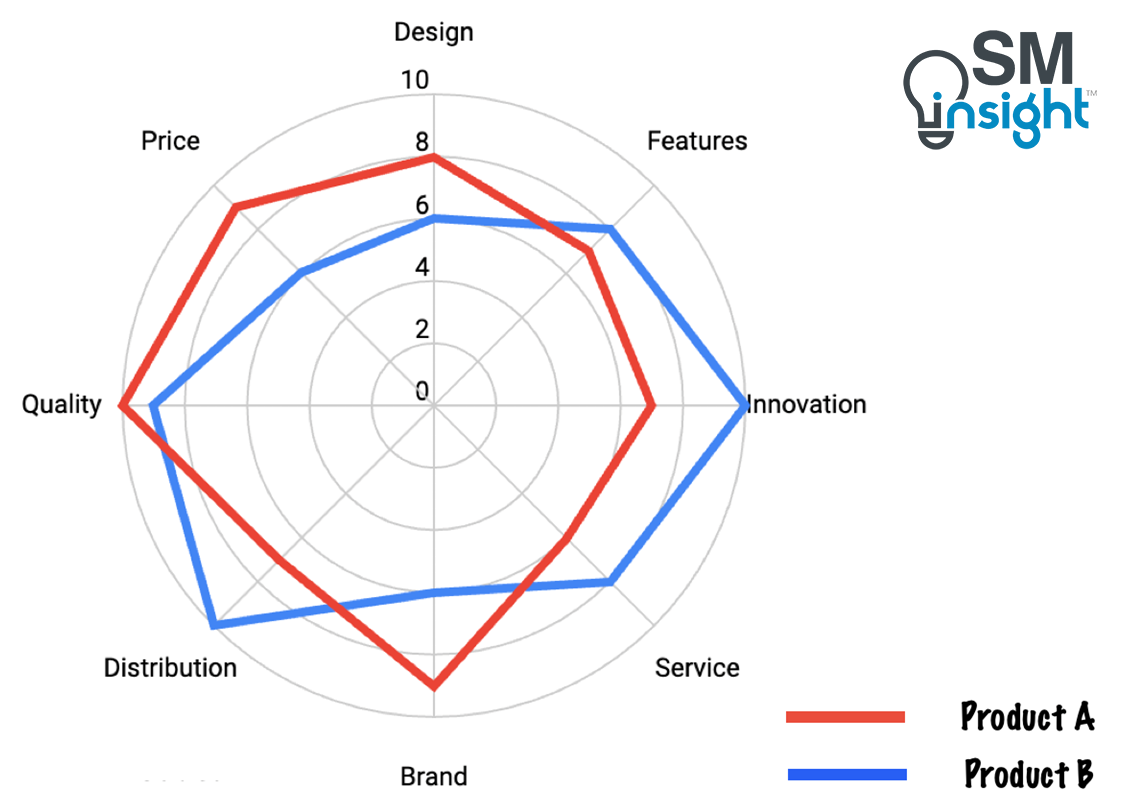
The radar chart shown at the beginning of this article is one of many tools for analyzing benchmarking data and presenting results.
Broadly speaking, a benchmarking study uses such tools for three primary applications:
- For investigation – to identify relationships between variables or find differences in performance levels. Statistical analyses and charts are commonly used for this purpose.
- To summarize data – simple statistics such as the mean, quartiles and regression lines are common tools, and these are often superimposed on charts.
- To communicate conclusions to others. For example, charts and graphs
The table below provides the most popular charts and analysis tools commonly used by non-statisticians:
| Tool | Use case |
|---|---|
| Table of Data [19] | For looking up and comparing key numbers or attributes between participants |
| Histograms [20] | For presenting a graphic summary of the distribution of a set of data. Mostly used for analysis rather than presentation |
| Run charts [21] | For revealing trends or patterns in the data. It helps identify the maximum, minimum and the mean values |
| Scatter diagrams [22] | To determine variation in data and if the variation is related to another variable. It helps visualize relationships better than in a table |
| Control charts [23] | Is a run chart with control limits. Helps determine the boundaries within which the data will lie |
| Bar charts [24] | Displays the relationship between two variables, one of which is numeric, the other of which is a category |
| Ranked bar charts and Pareto charts [25] | An improvement over the bar chart that orders the bars in decreasing (or increasing) frequency. They help focus on the most important factors |
| Radar (spider) charts [26] | To summarize the relative position of a participant within the benchmarking study |
| Pie charts [27] | As an alternative to bar charts. Shows the same information as the bar chart and is split into many slices. It is usually easier to read than a equivalent bar chart |
| Force field analysis [28] | A useful tool for displaying forces for and against a proposal, idea, or implementation |
Sources
- “BENCHMARKING”. Stratechi.com, https://www.stratechi.com/benchmarking/. Accessed 21 Feb 2024
- “THE FLINTSTONES”. Warner Bros, https://www.warnerbros.com/tv/flintstones. Accessed 16 Feb 2024
- “8 creative ways The Flintstones brought technology to Bedrock”. MeTV Chicago, https://www.metv.com/lists/8-creative-ways-the-flintstones-brought-technology-to-bedrock. Accessed 16 Feb 2024
- “WHAT IS TOTAL QUALITY MANAGEMENT (TQM)?”. American Society for Quality, https://asq.org/quality-resources/total-quality-management. Accessed 16 Feb 2024
- “What is KAIZEN”. Kaizen Institute, https://kaizen.com/what-is-kaizen/. Accessed 16 Feb 2024
- “Michael Porter”. The Economist, https://www.economist.com/news/2008/08/01/michael-porter. Accessed 16 Feb 2024
- “WHAT IS THE ISO 9000 STANDARDS SERIES?”. American Society for Quality, https://asq.org/quality-resources/iso-9000. Accessed 16 Feb 2024
- “Quality circle”. Wikipedia, https://en.wikipedia.org/wiki/Quality_circle. Accessed 16 Feb 2024
- “BALDRIGE PERFORMANCE EXCELLENCE PROGRAM”. National institute of standards and quality, https://www.nist.gov/baldrige. Accessed 16 Feb 2024
- “ABOUT EFQM”. EFQM, https://efqm.org/about/. Accessed 16 Feb 2024
- “The Benchmarking Book”. Tim Stapenhurst, https://www.sciencedirect.com/book/9780750689052/the-benchmarking-book. Accessed 21 Feb 2024
- “Nikon D5600 vs. Pentax K-70 vs. Canon EOS 600D”. DPREVIEW, https://www.dpreview.com/products/compare/side-by-side?products=nikon_d5600&products=pentax_k70&products=canon_eos600d. Accessed 16 Feb 2024
- “Taking Pole Position In Your Industry: Learning From FORMULA 1”. Forbes, https://www.forbes.com/sites/amazonwebservices/2021/10/28/taking-pole-position-in-your-industry-learning-from-formula-1/?sh=17a5bf8840e1. Accessed 18 Feb 2024
- “About Best Practices”. Best Practices, LLC, https://www.best-in-class.com/about-us. Accessed 18 Feb 2024
- “Benchmarks”. McKinsey & Company, https://www.mckinsey.com/industries/financial-services/how-we-help-clients/gci-analytics/our-offerings/benchmarks. Accessed 18 Feb 2024
- “Baldrige Excellence Builder”. BALDRIGE PERFORMANCE EXCELLENCE PROGRAM, https://www.nist.gov/baldrige/products-services/baldrige-excellence-builder. Accessed 19 Feb 2024
- “Baldrige Asks, “How Do You Know?””. National Institute of Standards and Technology, https://www.nist.gov/system/files/documents/baldrige/publications/How_Do_You_Know.pdf. Accessed 19 Feb 2024
- “5 surprising ways Formula 1 is changing the world”. World Economic Forum, https://www.weforum.org/agenda/2020/11/formula-one-f1-innovation-ventilators-fridges/. Accessed 20 Feb 2024
- “Table”. Wikipedia, https://en.wikipedia.org/wiki/Table_(information). Accessed 22 Feb 2024
- “How a Histogram Works to Display Data”. Investopedia, https://www.investopedia.com/terms/h/histogram.asp. Accessed 22 Feb 2024
- “Run charts”. Wikipedia, https://en.wikipedia.org/wiki/Run_chart. Accessed 22 Feb 2024
- “Scatter plot”. Wikipedia, https://en.wikipedia.org/wiki/Scatter_plot. Accessed 22 Feb 2024
- “CONTROL CHART”. American Society for Quality, https://asq.org/quality-resources/control-chart. Accessed 22 Feb 2024
- “Bar chart”. Wikipedia, https://en.wikipedia.org/wiki/Bar_chart. Accessed 22 Feb 2024
- “WHAT IS A PARETO CHART?”. American Society for Quality, https://asq.org/quality-resources/pareto. Accessed 22 Feb 2024
- “what is a spider chart?”. MIKE CISNEROS, https://www.storytellingwithdata.com/blog/2021/8/31/what-is-a-spider-chart. Accessed 22 Feb 2024
- “Pie chart”. Wikipedia, https://en.wikipedia.org/wiki/Pie_chart. Accessed 22 Feb 2024
- “Force-field analysis”. Wikipedia, https://en.wikipedia.org/wiki/Force-field_analysis. Accessed 22 Feb 2024