What is Gap Analysis
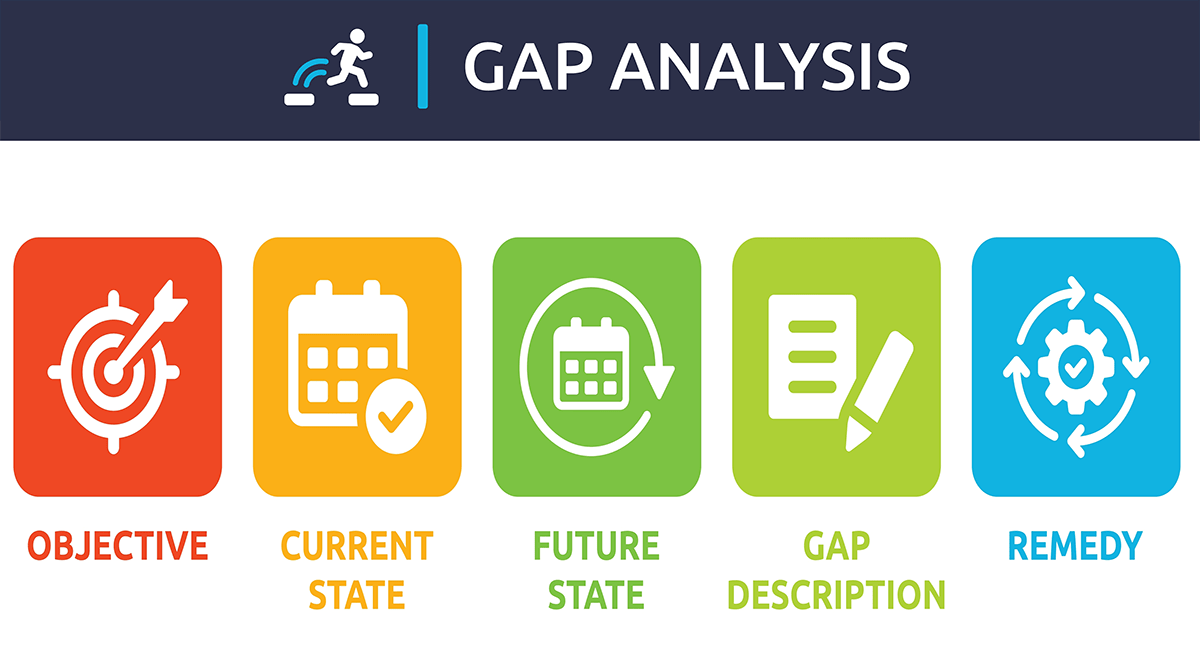
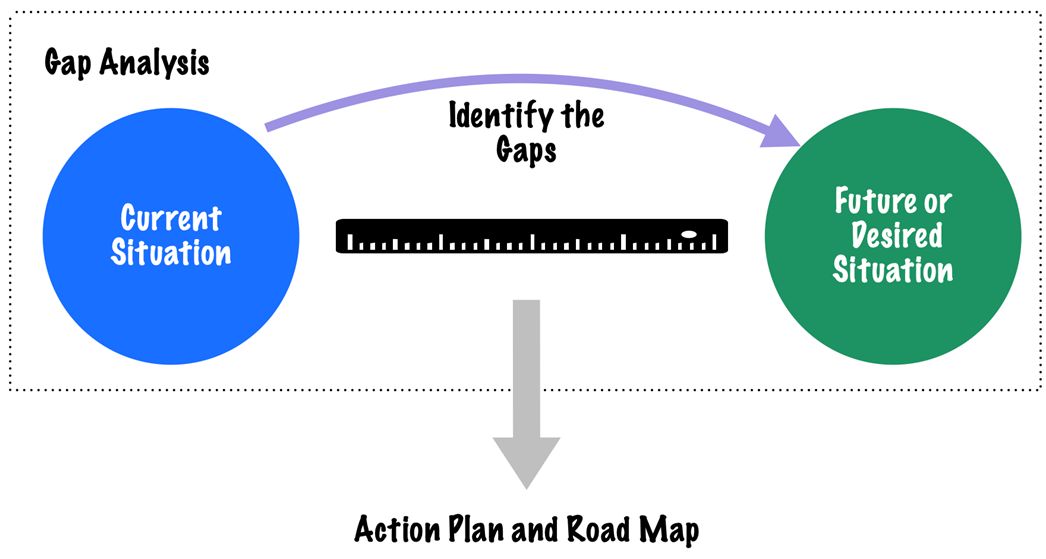
Gap Analysis is the examination and comparison of two views of a business system: the current or ‘as is’ view – the situation as it exists, and the desired or ‘to be’ view – a conceptual, desired future.
The aim of Gap Analysis is to determine where the current situation has problems or ‘gaps’ that need to be resolved. The differences identified between the two views provide the basis for defining the actions needed to implement/improve the future view.
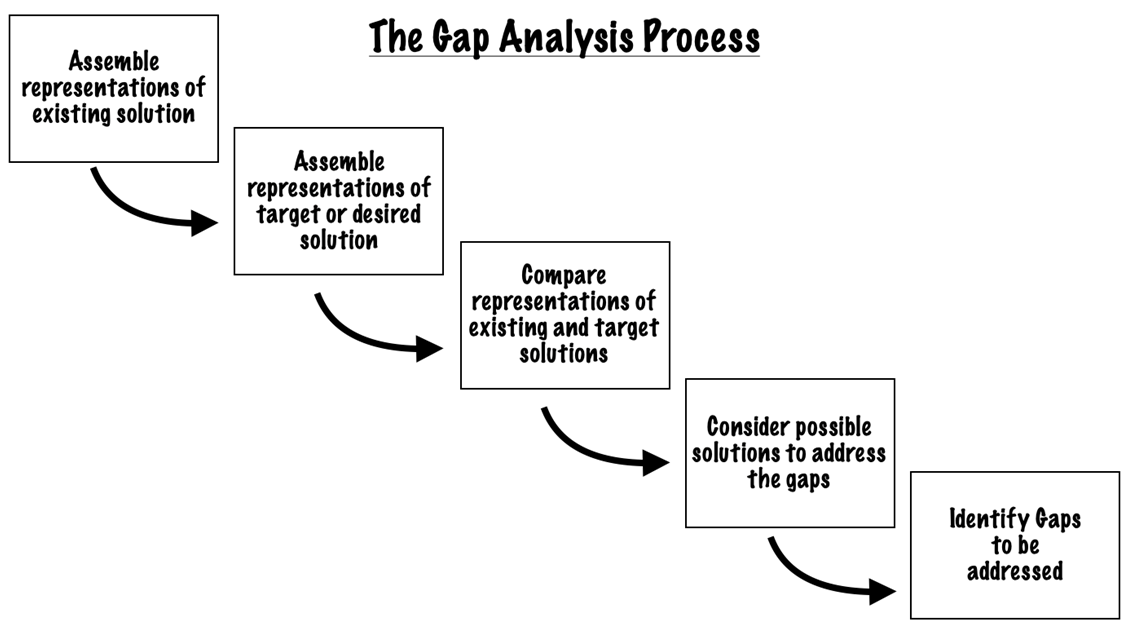
Gap Analysis is a systematic process that follows the following steps:
Why use Gap Analysis
By performing a Gap Analysis, organizations benefit from a high-level view of the business that identifies suboptimal or missing strategies, processes, technologies, or skills. By discovering such gaps early, corrective actions can be taken in advance.
Some of the reasons why a business might choose to perform a Gap Analysis are[3],[4]:
- Assess gaps between new strategies and existing resources to guide informed adjustments for successful shifts.
- Analyze gaps caused by market shifts, enabling timely adjustments to stay competitive.
- Identify gaps when introducing or updating products, ensuring seamless integration and success.
- Uncover process gaps for targeted enhancements, boosting efficiency and productivity.
- Evaluate gaps during mergers, harmonizing strategies, and processes for smooth integration.
- Respond to unexpected gaps swiftly, adapting to emerging challenges or opportunities.
- For benchmarking – comparing results against external criteria, for example – industry performance or competitors.
- Examining product portfolio to look for both – new product opportunities as well as existing products that are not selling well.
- Determine reasons why a company is/was unable to achieve targeted profits.
- Performance indicators-based Gap Analysis such as new customer acquisition, average order amount, or return on investment (ROI).
- Analyze usage gaps, such as the difference between the current market size for a product or service and the potential market size.
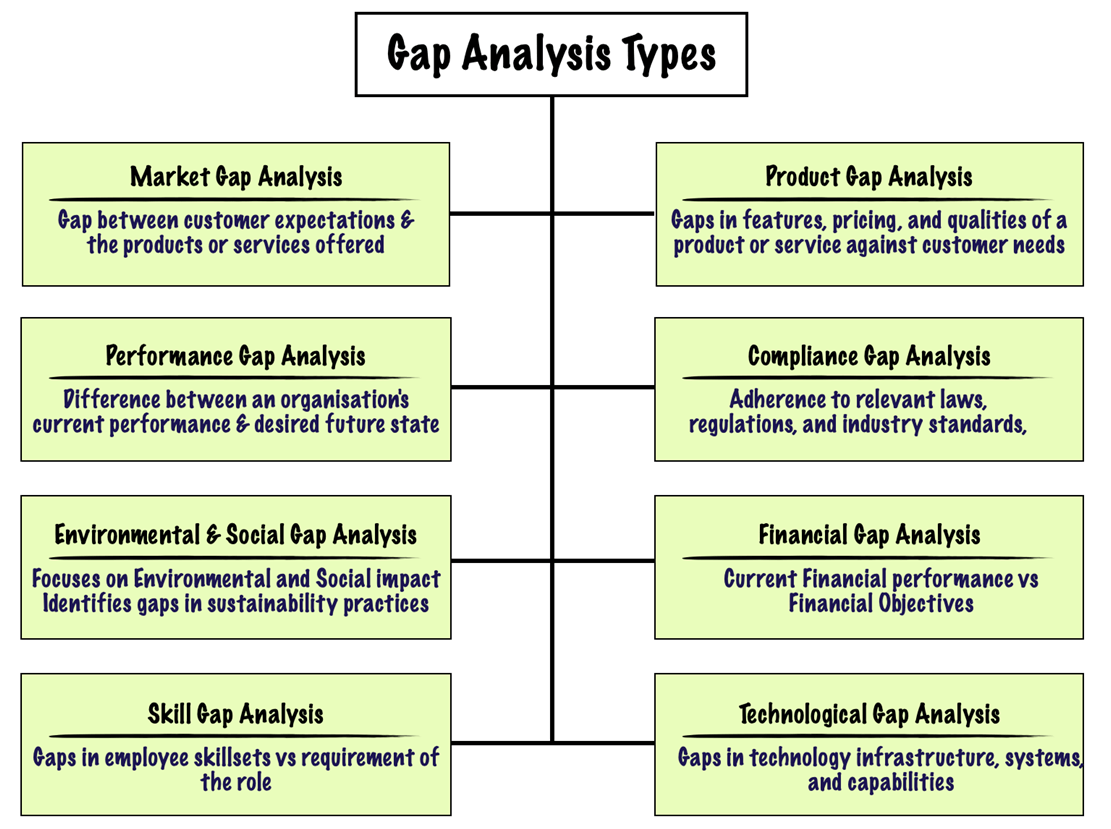
Types of Gap Analysis
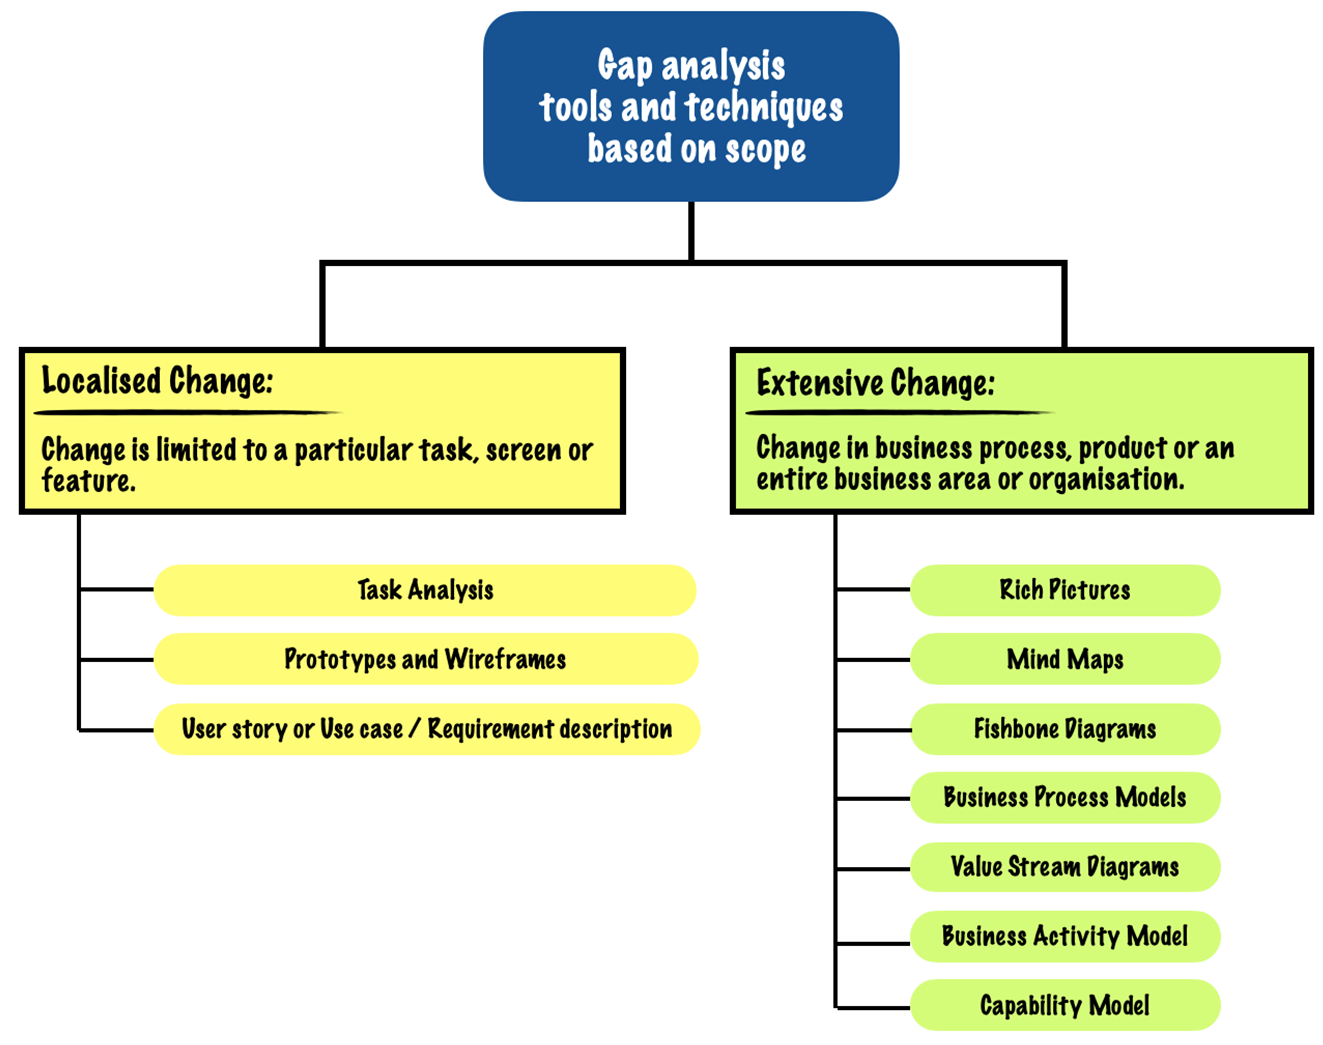
As seen from its applications, a Gap Analysis can be performed for different reasons and can tackle specific challenges and opportunities within an organization. They are classified as shown in the figure below:
Performing Gap Analysis
Step 0: Internal Capabilities Analysis
Prior to performing a Gap Analysis, a good understanding of the organization’s mission, objectives, and tactics becomes necessary. This can be achieved by analyzing the documentation or liaising with the leadership team.
The MOST technique[5] can be used in this step. MOST involves defining the Mission, Objectives, Strategy and Tactics of an organization and helps analyze its direction.
Mission defines the sole purpose for which the firm exists. For example, McDonald’s mission is to deliver/serve reasonably priced fast food with consistent quality worldwide.
The Objective contains clear long and short-term goals and obligations that the firm wants to achieve. For example, a bank’s long-term goal can be to attain a high level of asset quality. A short-term objective can be to reduce paper transactions to 20% while an obligation could be to contribute to price stability in the region.
Strategy generally refers to a long-term plan of action to achieve long-term goals. An example of strategy can be “use technological advancements to maximize performance and improve operations.”
Tactics are short-term plans of action. For example, “Engineer a system to cater to real-time monitoring of social media posts.”
Having analyzed the organization’s internal capabilities, the way Gap Analysis is conducted depends upon the techniques used to represent the two views (‘as-is’ and ‘to-be’).
The process typically involves the following steps:
(tools referred to in these steps are explained later in this article)
Step 1: Investigating and modeling the existing situation
This involves the use of diagrammatic techniques such as Mind Maps and Rich Pictures that help effectively represent the range of issues inherent within an existing situation, including cultural and personal issues.
A set of ‘as is’ Business Process Models are also used to represent a process view of the existing situation.
The POPIT model is another effective tool that sets out the five areas to consider – Process, Organization, People, Information, and technology.
It is important to acknowledge that no one tool addresses the investigation and modeling process. A variety of techniques are needed to depict the range of issues present in an existing business situation.
Step 2: Analyze and develop a representation of the desired situation
This step involves the analysis of perspectives, concerns, and objectives, and developing a representation of the desired situation. The techniques used in this step should provide a conceptual representation of a future business situation. This is sometimes referred to as the ‘target’ model.
Business Activity Modeling could be used for this purpose as it provides a holistic view of a business system and is a conceptual modeling technique.
Sometimes ‘to be’ Business Process Models are used, but they can only provide a process perspective rather than a target operating model for the entire business system. While they explain ‘how’ the work is carried out, they do not cover all the required areas, such as the planning and enabling activities. As a result, they should be supplemented by other techniques, such as organization charts and Business Capability Models.
Step 3: Compare
Compare and contrast the two views to identify the differences and the actions that would be required to move from the existing situation to the target situation.
A Gap Analysis contrasts the existing and target views by considering the following questions:
- Do the desired activities, processes and tasks exist in the current business system?
- Do the current activities, processes and tasks work well, or are there problems?
- How extensive is the problem with the current activities, processes and tasks?
When a Business Activity Model is developed, each of the activities on the model should be classified into one of the following categories:
- Existing and satisfactory.
- Existing but not satisfactory.
- Not existing.
Prioritizing the gaps
Once the activities have been classified, they must be prioritized for further, more detailed analysis. It is possible that some areas are of low priority due to little room for improvement or because they are not within the scope of the study.
Gaps that are of priority can be further analyzed by asking the following questions:
- What work should the activity cover, as compared with what it currently covers?
- How important is the activity and how imperative is it to business success?
- What business events should the activity handle?
- Is there an existing process that carries out this activity and handles this event?
- What are the gaps between the existing and future processes (represented by ‘as is’ and ‘to be’ process models) to handle these business events?
- Are there any standards (internal or external) that should be followed when performing this activity?
- Are there any existing performance measures to be monitored and are there any new ones to be defined?
- How well do the IT systems support the activity?
This analysis work often requires additional investigation of the activities and processes to clarify the gaps and problems.
Gap Analysis results in a list of change actions that need to be made to bridge the gap between the current and desired business system. These change actions form the basis for the next step, which is Options Identification[1] to bridge the gap.
Tools and Techniques for GAP Analysis
Gap Analysis can apply at different levels, depending upon the situation and may call for a localized or extensive change. The extent of the change determines the scope of the Gap Analysis activity and the tools/techniques used to represent the existing and target situations.
Approaches to Gap Analysis for localized and extensive change can be separated as follows:
1. Task Analysis
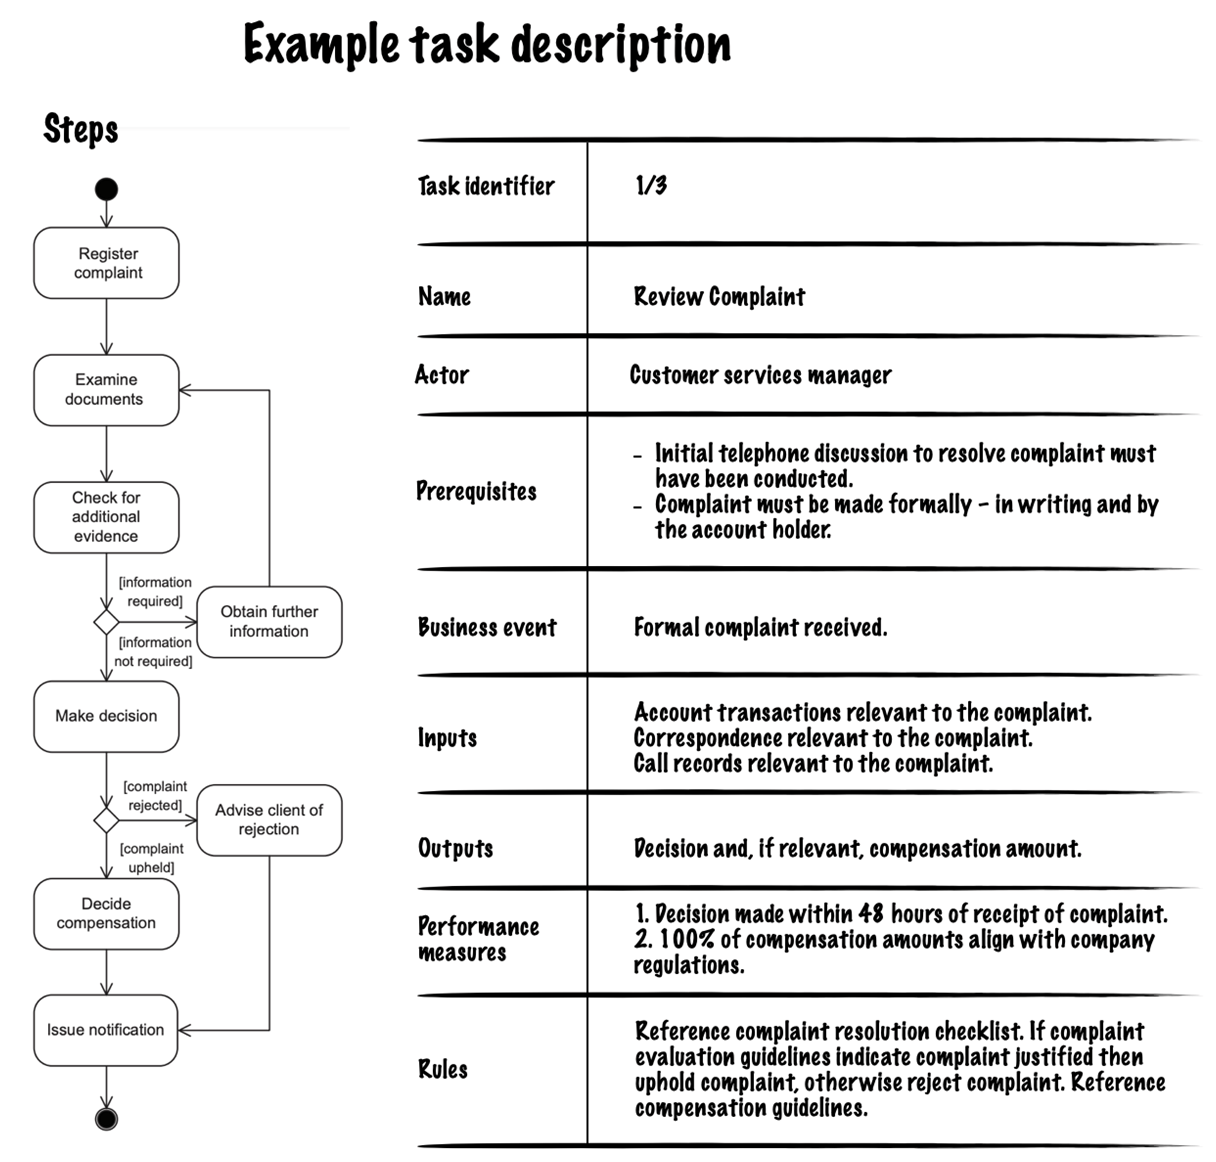
Task analysis[6] is a technique used to analyze the work conducted during a given task. The analysis considers the event that triggers the task, the input information, outputs, steps, measures and decisions.
Task analysis is also a useful technique for uncovering the decisions made while performing a task and identifying the alternative scenarios that may result. A task definition must typically include the following elements:
Task identifier: A unique identifier for the task. This is usually a combination of an identifier for the business process within which the task is conducted and the individual task; for example, 2/1 would indicate that this is process number 2, task number 1
Name: The name of the task as shown on the process model. This name should use the format <imperative verb, noun>; for example, ‘Review complaint’
Actor: The title of the actor who performs the task; for example, ‘Customer services manager’
Prerequisites: Anything that must be true before performing the task; for example, there must have been a prior discussion with the customer. The complaint must have been made formally in writing.
Business event: The trigger that initiates the task; for example, ‘Complaint received’.
Inputs: The information used to perform the task or, in physical processes, resources such as materials that are needed to perform the task. Some inputs may be received during the task. Inputs also include documents used during the task.
Output: The information created by the task or the artifacts that result from the task; for example, the decision regarding the complaint. This may also include documents created or updated during the task.
Goals: The goals to be achieved by the task; for example, to resolve the complaint in line with company regulations.
Performance measures: The measures used to evaluate the performance of the task. These may be concerned with accuracy or productivity; for example, each complaint must be resolved within 48 hours.
Steps: The individual steps required to conduct the task, including those to handle alternative scenarios. These steps may be documented as a list or a diagram.
Decisions/ business rules: The decisions to be made when conducting the task and the rules that determine which decisions are correct.
Having defined the task, its analysis begins with understanding where the task sits within the business process model of which it is a part. This helps to obtain a context for the task by understanding which tasks have preceded it and which will follow.
In a Gap Analysis, this helps clarify aspects such as the name of the actor, any essential prerequisites and the initiating business event, and any outputs that will be used by any following tasks.
2. Prototypes and Wireframes
Prototyping[7] involves building simulations of a process or system in order to review them with the business representatives and thereby increase understanding of the requirements. There are three aspects to be considered when building prototypes:
- Scope to be covered by the prototypes – is it to demonstrate how a particular screen should look, or is it a prototype of an entire system or process?
- High or low-fidelity – prototypes can range from sketches drawn on paper to detailed simulations of actual screen displays developed using the application software.
- Functionality – how extensive should the functionality of the prototypes be? Should the prototype access and use data, and if so, will the data be created solely for the purpose of the demonstration or should the prototype access fully operational system data?
Wireframes[8] offer a similar approach to prototypes but are created primarily to show the layout of a screen, document, or website page and to indicate how the elements and any navigation between them might work.
Wireframes usually lack images, colors, or graphics, so they may be viewed as outline prototypes. They may be created using software applications designed for drawing purposes or may be created by hand using paper or a whiteboard. Collaboration tools, such as digital whiteboards, may also be used to create wireframes.
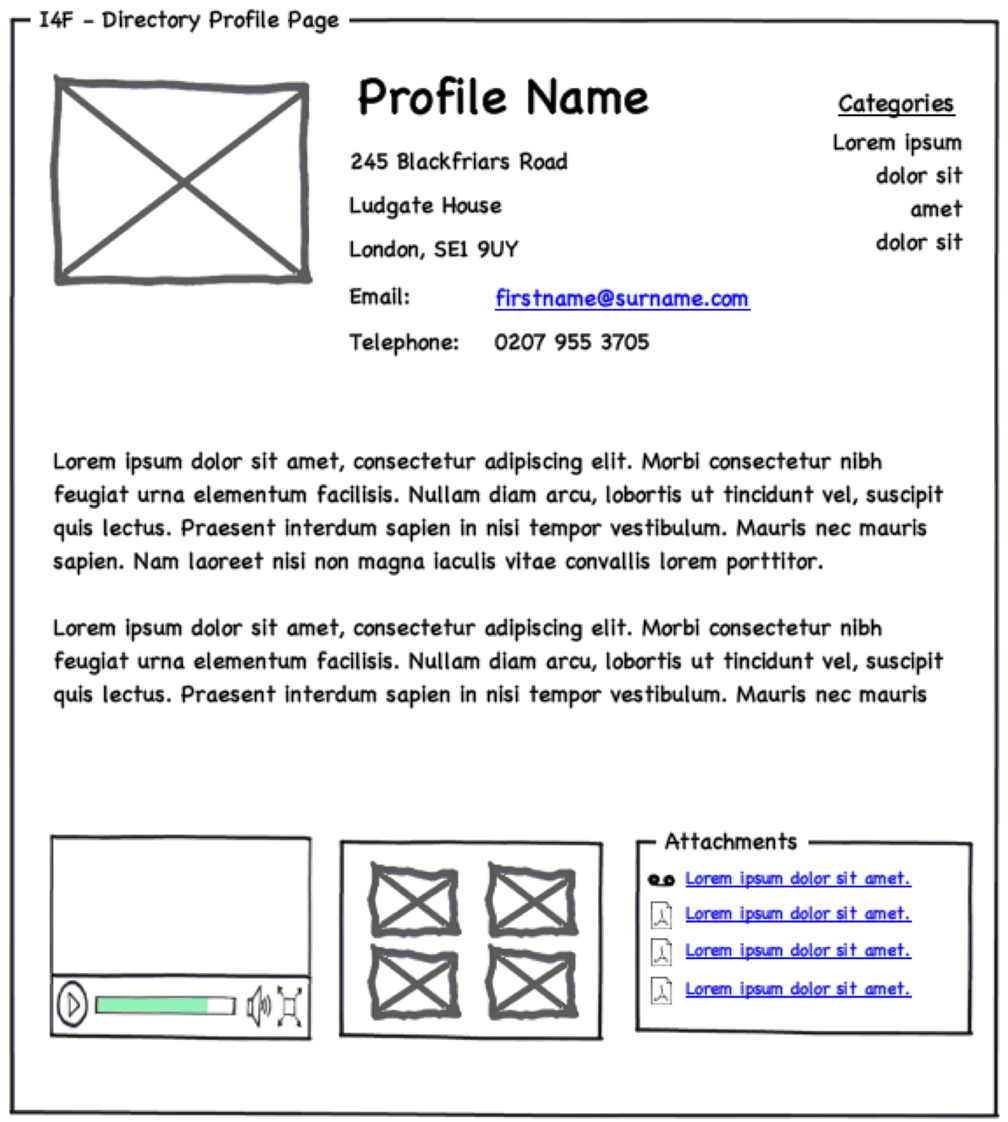
In a Gap Analysis, prototypes and wireframes offer a way of demonstrating how the new processes or system might work and by providing a concrete basis for evaluation and discussion.
3. Use case, User story & Requirement description
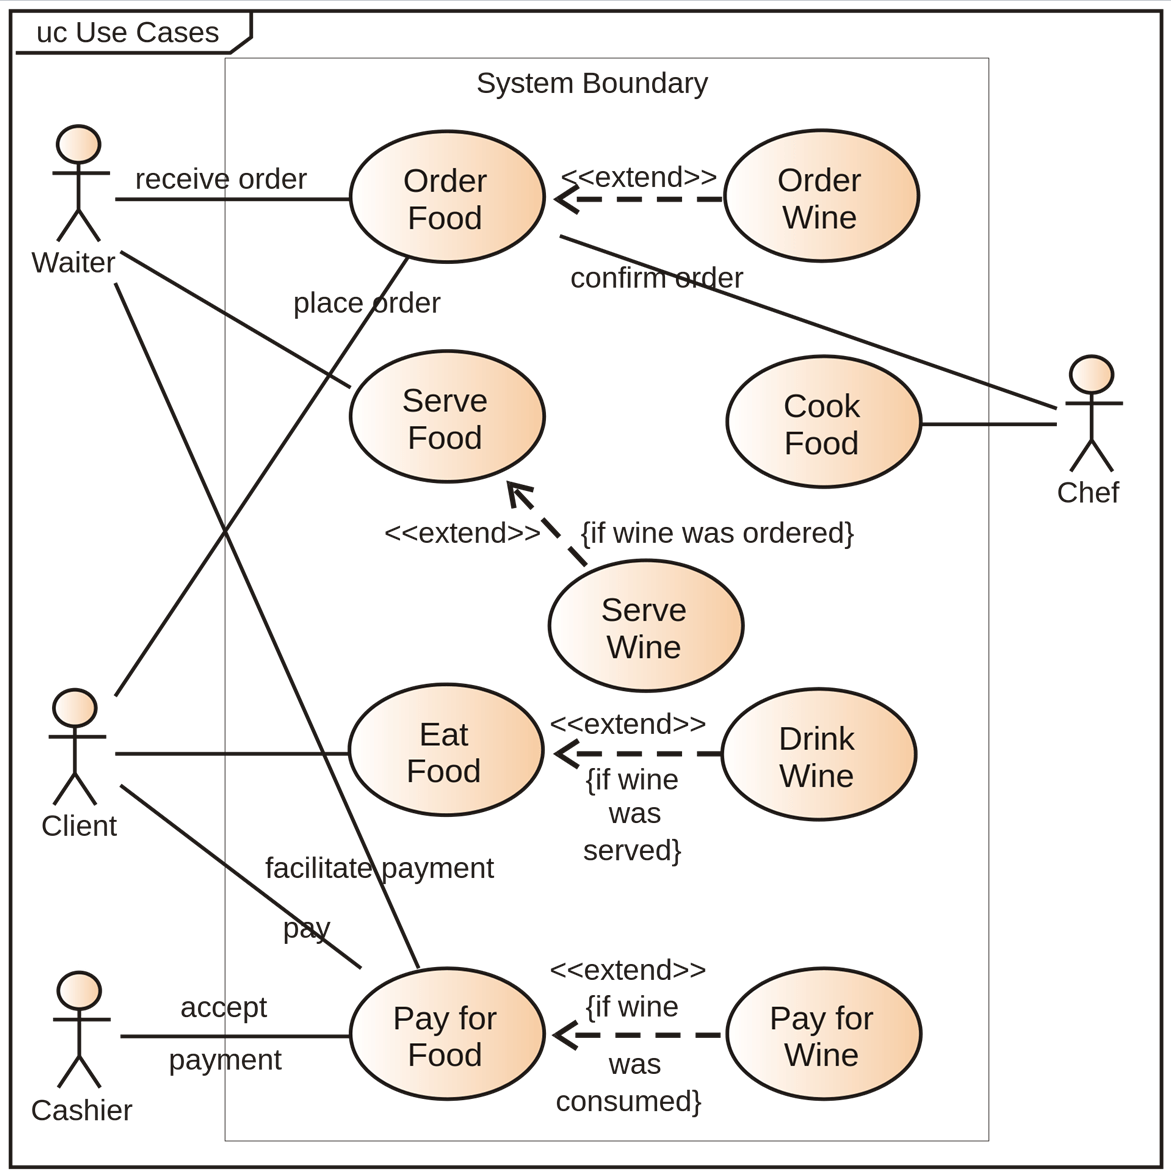
A Use Case[10] is something that an actor wants a system to do and describes the interaction between the actor and the system. Each use case has a stated goal and contains a description of the actions that a system must perform to achieve this goal.
Use cases are shown as ovals and represent the functions that the system should perform in response to a triggering event initiated by the actor. The ‘verb noun’ convention is used to name use cases. For example, ‘Set up project’ or ‘Book room’ etc.
A User Story[12] is used to define requirements for Agile software development projects. Compared to the ‘use case’, they are much smaller functional units.
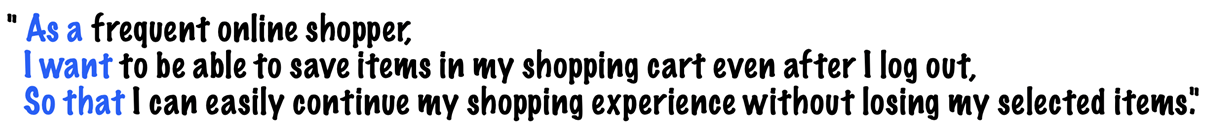
User stories are hierarchical and employ a standard syntax as below:
- As a (role or actor – the ‘who’);
- I want (the capability that is required – the ‘what’);
- So that (the business value that is being delivered – the ‘why’).
This standard syntax provides a basis for a rich conversation about the user’s story between business actors and developers.
User stories always come with a ‘confirmation element’, which is essentially the addition of test and acceptance criteria that allow confirmation that the user story is complete and satisfies the business need.
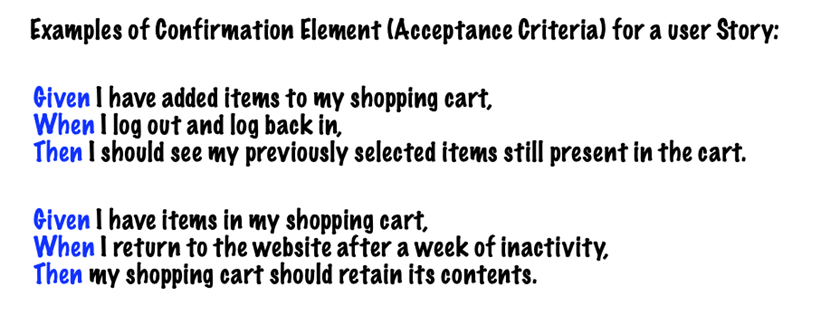
Similarly, a Requirement Definition[13] also provides a communication channel between the business actors and those developing and testing the solution. They provide a clear definition of what is required from the solution and enable the creation of test plans and expected results.
A key quality criterion for a requirement is that it is ‘testable’, which means that the requirement is defined such that the solution may be tested to confirm that the requirement has been satisfied. To facilitate this, each requirement description should include relevant acceptance criteria.
In a Gap Analysis, use cases, user stories, and requirement descriptions clarify the current system state, user needs, and desired features. They aid Gap Analysis by revealing existing gaps, prioritizing improvements, and guiding development toward the desired future state.
4. Mind Maps
A Mind map (also known as a semantic network or concept map) is a visual representation of a set of ideas, words, things or tasks and the relationships between them[14].
A mind map can be used in several situations, from analyzing dependencies to conducting workshops to organizing information. The range in style from hand-drawn to computer-generated and from simple text to highly illustrated. Hand-drawn mind maps can be used when taking personal notes or for display and discussion purposes during meetings.
A mind map starts with a central idea that represents the ‘trunk’ of the model. It then shows the subsidiary themes, the main ‘branches’ of the idea. These branches can then be developed into more and more detail. Cross-connections can be made between the different ‘twigs’.
The below diagram shows an example of a mind map:
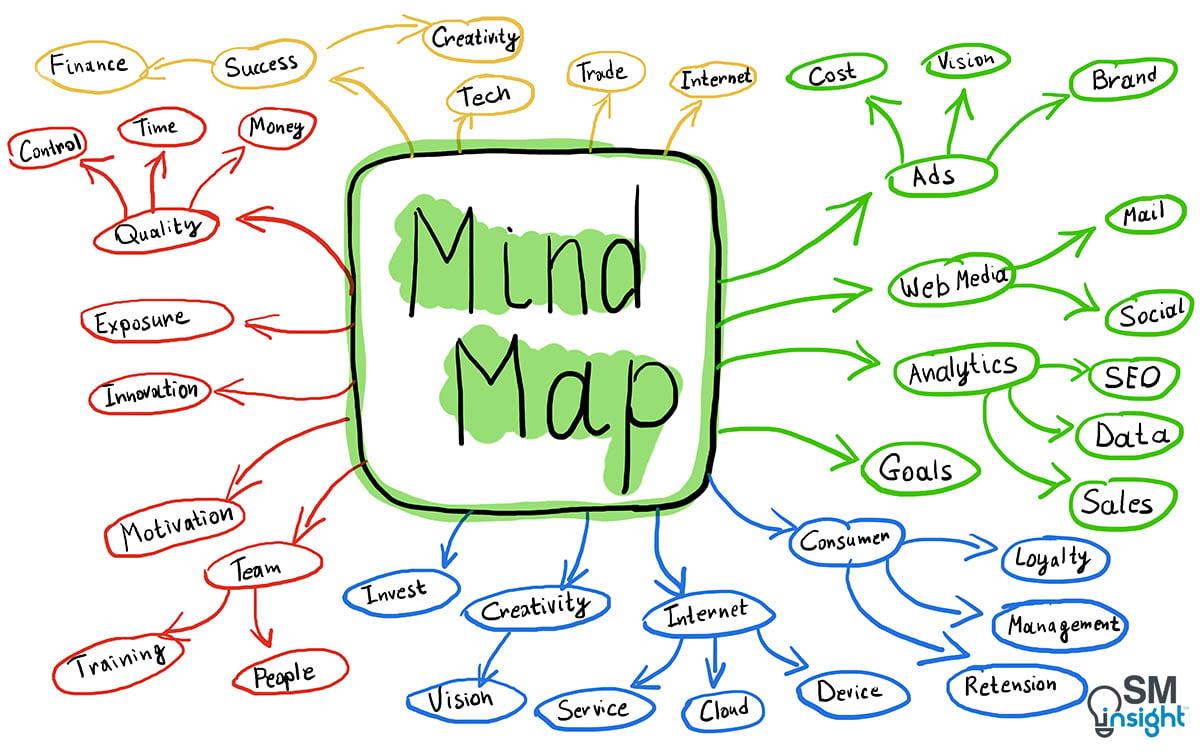
Example of a mind map. More example types can be found in Wikipedia[15]
Creator Tony Buzan[16] claims that mind maps work because they reflect the way the human mind organizes information – a central theme leading to subsidiary concepts that extend into further levels of detail.
In performing a Gap Analysis, they help provide focus, clarity, and brevity whereas more conventional notes sometimes obscure key issues and information with irrelevant details.
5. Fish Bone Diagram
The fishbone diagram is a problem-analysis technique designed to help uncover the underlying causes of an inefficient process or a business problem. It has similarities to a mind map but its purpose is strictly diagnostic rather than recording.
The technique was invented by Dr Kaoru Ishikawa and the diagrams are sometimes known as Ishikawa diagrams[17]. Fishbone diagrams are used to analyze the root causes of specific business problems.
In any business problem, while some of the causes may be obvious or the stakeholders may be aware of the root causes of their problems, sometimes it is only the symptoms that are highlighted by the stakeholders because the causes are deep-rooted or have proved difficult to isolate.
Fishbone diagrams help in identifying where the problems are and discovering their underlying causes. An example of a fishbone diagram showing possible reasons for poor customer satisfaction is shown below:
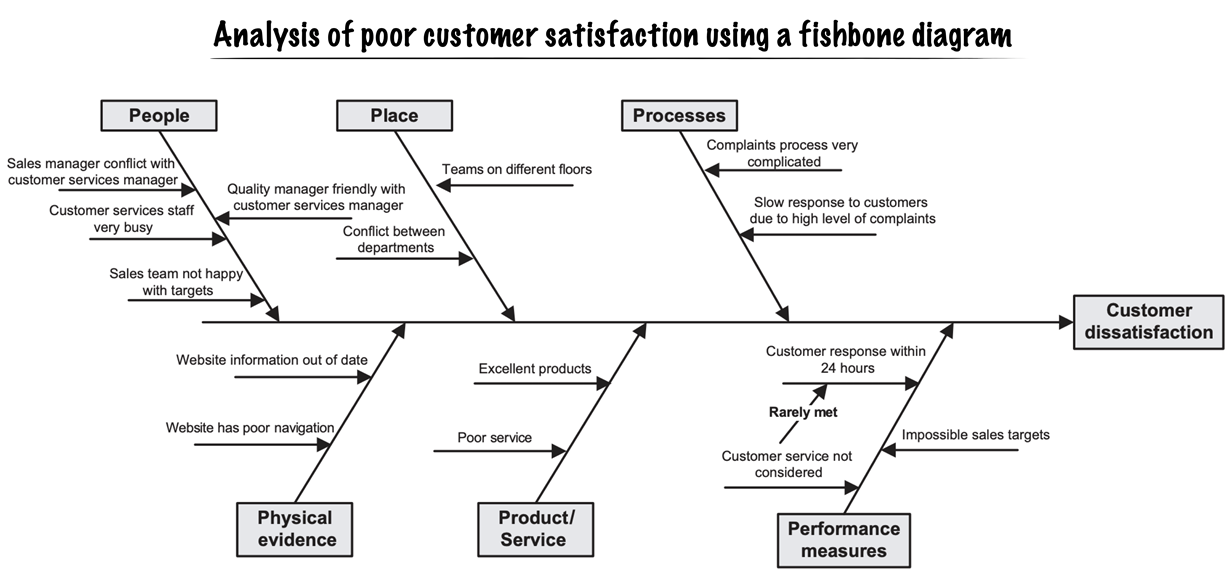
A fishbone diagram is drawn by putting the business problem in a box on the right-hand side of the diagram. A line is drawn from this box towards the left of the page and represents the backbone of the ‘fish’. Radiating up and down from this backbone are spines, each of which suggests possible areas where the causes of the problem may be found.
Several approaches may be used when labeling the spines, such as:
- The 4Ms: Manpower, Machines, Measures And Methods
- An alternative 4Ms: Manpower, Machines, Materials And Methods
- The 6Ps: People, Place, Processes, Physical Evidence, Product/Service and Performance measures
- The 4Ss: Surroundings, Suppliers, Systems, Skills
These categories help list areas that have been found to be the sources of inefficiencies in many business systems. Data for this analysis can be found from workshops, interviews, observation, activity sampling and special-purpose records.
As with mind maps, the spines may have more detailed elements associated with them. Each category along a spine is examined, and the factors within that category that may be affecting the problem are added to the diagram. The resultant diagram is shaped like a fishbone – hence the name ‘fishbone diagram.’
In performing a Gap Analysis, a fishbone diagram aids in identifying key causes of problems or gaps that may hinder the performance of an organization.
6. Rich Pictures
Rich pictures[18] capture in pictorial form a holistic view of a business situation or problem and facilitate discussion and analysis. There are no rules as to what may be captured in a rich picture or which symbols should be used – it is a completely free format technique.
The standard aspects to represent in a rich picture include:
- The principal actors in the business process or system.
- The views, ideas, and concerns of those actors.
- Anything uncovered about the structure of the organization, including the type of structure in place, the geographical locations, and the levels of management.
- Information and impressions about the business processes, such as the IT support systems, whether the processes are bureaucratic or very informal etc.
- An impression of the culture and climate of the organization. For example, is it a supportive environment or does a blame culture exist?
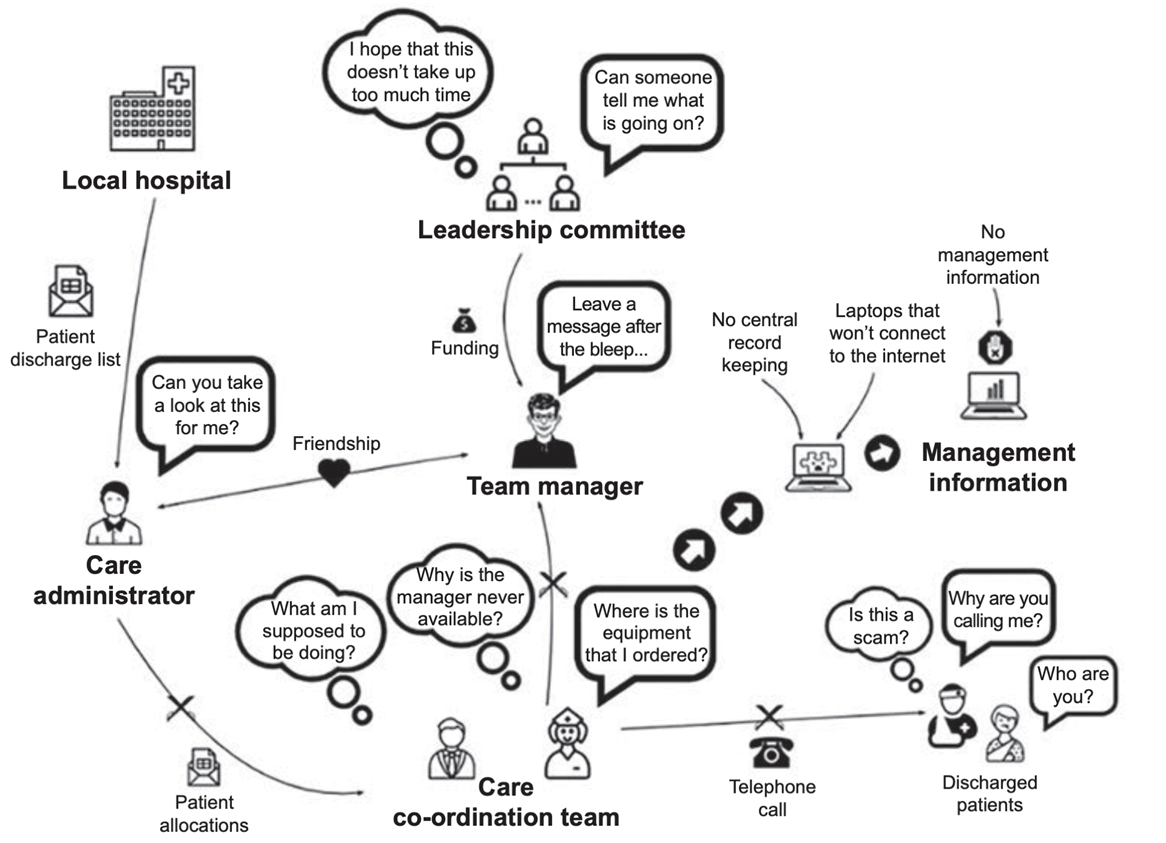
Rich pictures provide a mental map of a situation and summarize a significant amount of information, which could be many pages long if captured as text. It is a summary of the information that has been discovered in the initial situation investigation and the issues that may need to be investigated further.
When using rich pictures, organizational culture and the communication preferences of key stakeholders must be first considered. As the technique is highly visual, it may not be well received by non-visual thinkers or within organizational cultures that support highly formal approaches to communication.
In Gap Analysis, rich pictures can be used to capture current processes and express them in a highly visual form.
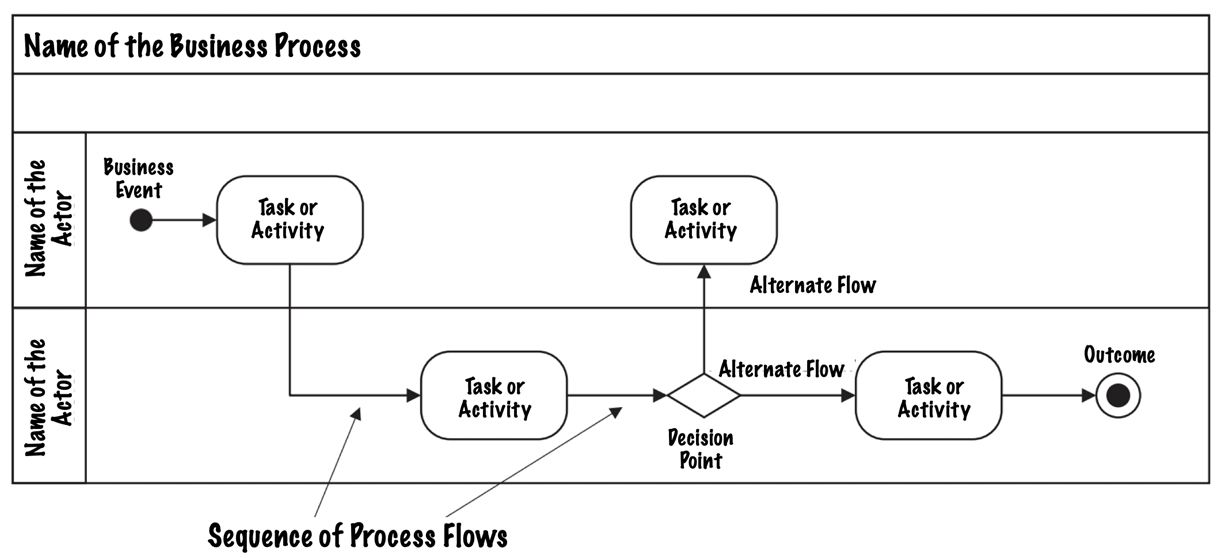
7. Business Process Models
A Business Process Model (BPM)[19] gives organizations a simple way to understand and optimize workflows by creating data-driven visual representations of key business processes. It is also known as a business process map, swim-lane diagram, or cross-functional diagram.
BPMs show the interactions between different actors and departments and illustrate the key elements of a business process, such as:
- The business event that initiates the process.
- The tasks that make up the process.
- The actors that carry out the tasks or activities.
- The sequence or flow of the tasks.
- The decisions that lead to alternative process flows.
- The endpoint or outcome of the process.
- Optionally, a timeline for the business process (shown at the bottom of the diagram).
- ‘Forks’ and ‘joins’ – when two or more tasks are performed in parallel.
There are numerous approaches to business process modeling, and they each have their own notation set. The most commonly used notations are the Unified Modeling Language (UML)[20] and the Business Process Model and Notation (BPMN)[21].
BPMs are built to represent the organizational response to each event within the initial set. The process of building BPM uncovers additional business events for which further business process models may need to be created.
BPMs are used for many purposes, including:
- To document an existing process.
- As a basis for training members of staff.
- To understand how the process works and where any problems lie.
- To provide a basis for business process improvement.
- To identify who carries out the work of a process.
- To show the sequence of process flow and the alternative flows.
When building a BPM, it is important to understand the event that initiates the process, the required outcome, and any possible alternative outcomes. The model is then built by considering each task within the process in turn.
The business event triggers an actor to carry out the initial task. At the conclusion of that task, the responsibility for the next piece of work passes to another actor and the flow between these tasks is represented in the model.
If the work could be passed to more than one actor, the decision point is shown with the reasons for the alternative process flows. Analysis of the tasks and their outcomes continues until the endpoint for the process is reached for all alternative paths.
As a visual documentation technique, BPMs are extremely useful when building a consensus view of processing.
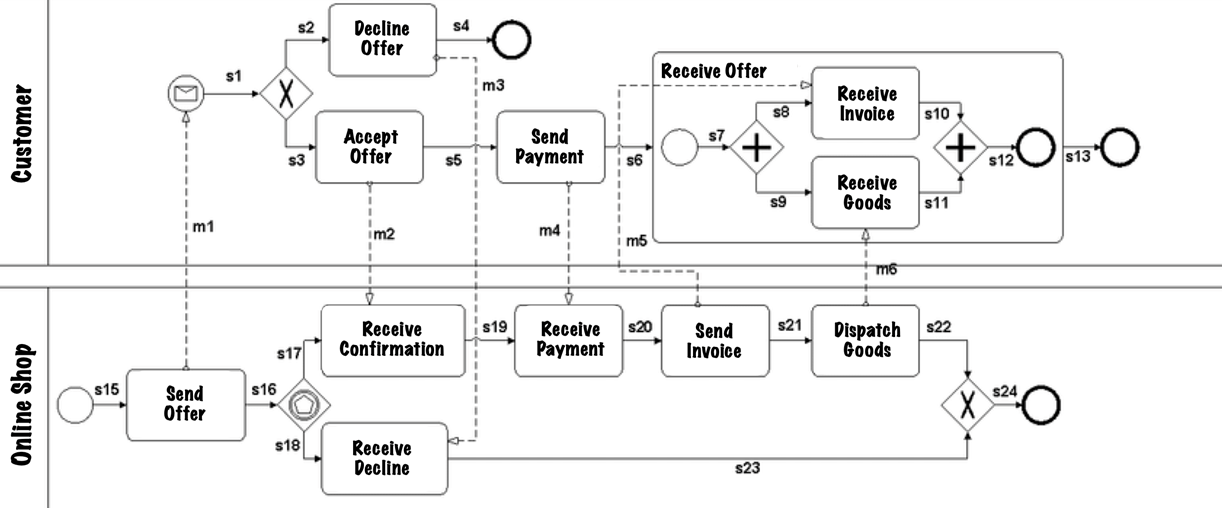
In a Gap Analysis, BPM helps by accurately depicting the current as-is situation, including actors, processes, and interactions.
8. Value Stream Diagrams
Value stream analysis is a conceptual modeling technique that shows the set of core activities required to offer a value item to an internal or external stakeholder. A value item may be defined as the product or service delivered by an organization that offers potential value to stakeholders.
In a Gap Analysis, Value Stream Diagrams (VSD) can be used to model either the current or target state. The activities modeled within a VSD are focused on the delivery of the product or service and do not dwell much on the supporting activities.
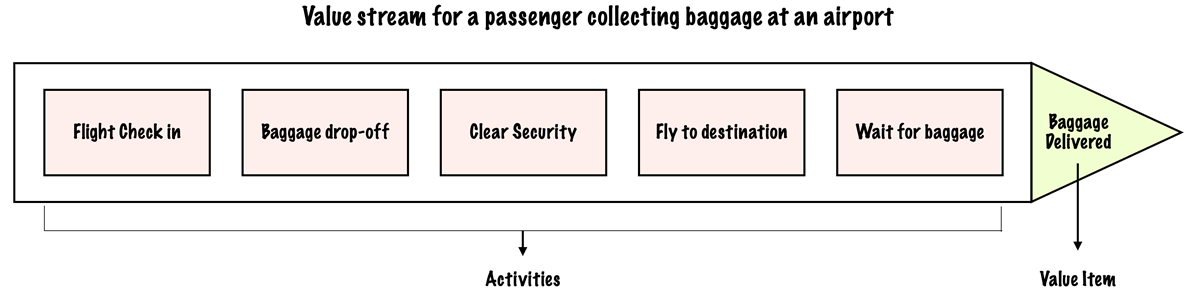
VSDs help to think creatively about how an organization might deliver value items and the potential for offering new value items in the form of new products or services. The activities that form a value stream are performed in collaboration with stakeholders, some of whom may be external to the organizational boundary.
Value stream diagrams should comply with the following guidelines:
- They should be stakeholder-focused – each stage should move towards the provision of the value item that offers benefit to the stakeholder.
- They should take a holistic, conceptual view – value stream stages should not include representations of detailed processes.
- They should facilitate further decomposition of stages – high-level stages on the value stream may be decomposed to help identify additional stakeholders and their value.
- They must identify where business capabilities may be utilized – all stages of a value stream are enabled by business capabilities.
- They should focus initially on the ultimate customer for the value item. This focus should then move to consider the internal and external stakeholders required to carry out the work of the value stream.
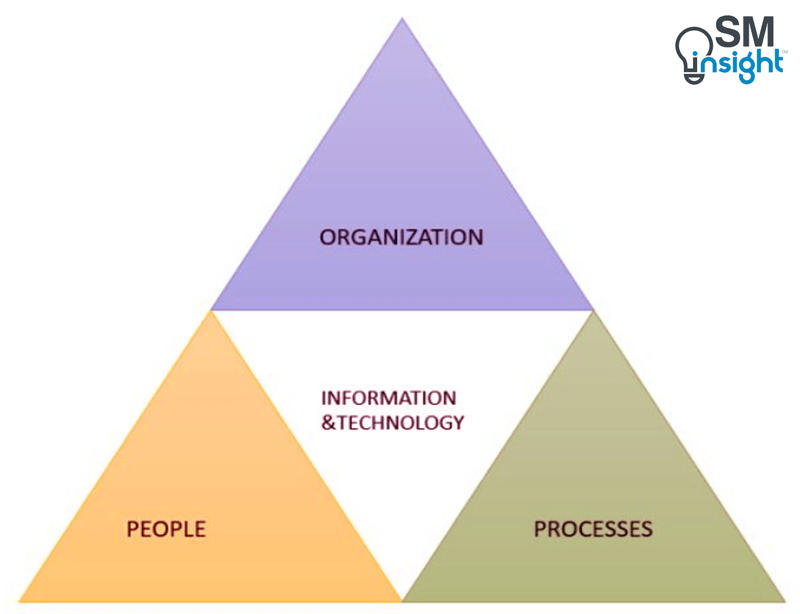
9. POPIT model
The POPIT[23] model identifies the five key elements to be analyzed when investigating and defining organizational change. These are People, Organization, Processes, Information and Technology.
Any organization or business system consists of these five elements that need to work in tandem. Changing one of these inevitably has an impact on the other four. All aspects need to work together in synergy for a business to be successful.
These five elements are described below:
Following are some of the example questions that can be asked while performing a situational investigation to construct a POPIT model:
People:
- What are the skills and knowledge required of the business actors?
- What are the motivation levels of the business actors?
- How do individuals communicate with each other?
- To what extent do the business actors understand the organization’s strategy?
Organization:
- What is the organization’s leadership and management style or business area?
- What is the culture of the organization?
- Is the structure of the organization, roles, and responsibilities documented and communicated? Is the structure optimal?
- Who are the key partners and suppliers?
- What is the nature of the relationship with each of these? Is this optimal?
- What resources does the organization have or rely upon?
- What is the business model of the organization? Is this optimal?
Processes:
- Are processes efficient, documented and well-communicated?
- Do processes meet the expectations of stakeholders?
- Do processes rely upon other resources (such as technology, information or data)?
Information:
- How variable are the outputs of processes?
- Do people have the information and data that they need to make decisions to work effectively?
- Are the information and data accurate?
- Are information and data seen as an asset?
- Are the information and data secure?
Technology:
- How well does technology support business processes?
- Is the technology usable and accessible?
- Does the technology enable the organization to meet strategic goals and objectives?
- Does the technology meet stakeholder needs and expectations?
In a Gap Analysis, the POPIT model can be used to identify the difference between the current and target states. It helps by defining the elements that need to be considered during a situation investigation to provide a holistic view of the business situation.
10. Business Activity Model
A Business Activity Model (BAM)[24] builds on the ‘transformation’ element of a CATWOE technique and presents a conceptual view of the business activities required to fulfil the worldview captured in the stakeholder perspective.
The CATWOE[25] technique is an approach to understanding the various perspectives of each stakeholder within a business and usually uncovers the following elements through interviews with each stakeholder: Customer(s), Actor(s), Transformation, World view, Owner and Environment.
A BAM model shows the high-level activities and the logical dependencies between them. This conceptual or idealized view can then be compared with representations of the current business situation to identify areas where, potentially, the performance of the organization could be improved.
A BAM is created after the initial investigation of the situation has taken place and the stakeholder perspectives have been analyzed. In a Gap Analysis, BAM provides a basis for identifying options for business improvement by showing what an organization would need to do to fulfill a stakeholder’s perspective.
A BAM model, however does not show how the activities are carried out. There are five types of business activity shown on a BAM as described below:
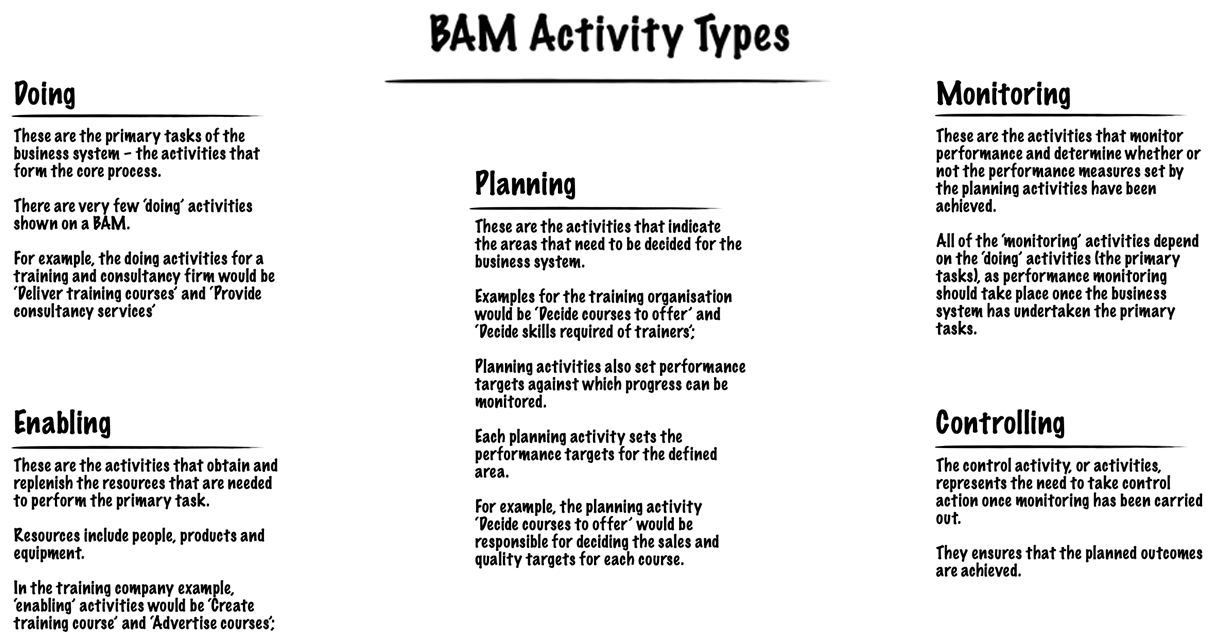
A BAM does not represent an actual or required business system but a conceptual view of the activities required to fulfill a stakeholder’s worldview. If there are several different world views among the stakeholders, it may be necessary to build several BAMs to explore these differences and negotiate an agreed worldview and BAM.
When building a BAM it can be useful to apply a numbering system to the activities for identification and cross-referencing purposes. This can also be used to indicate the type of each activity. In the example shown below, E1 is an enabling activity and M2 is a monitoring activity.
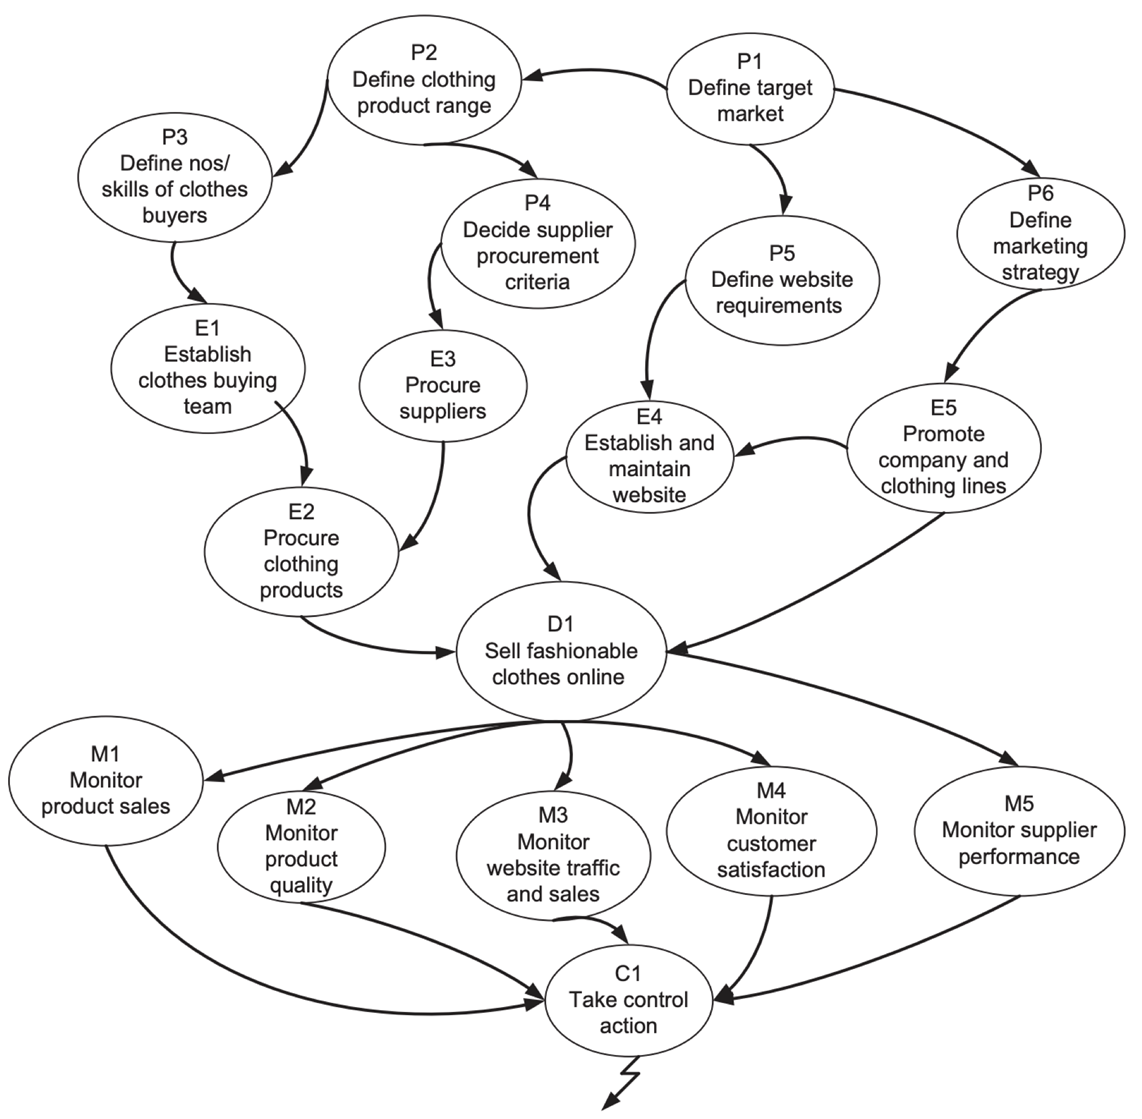
In a GAP analysis, a BAM provides a conceptual view of an agreed future state when compared to a representation of a current state.
11. Business Capability Model
A Business Capability Model (BCM)[26], also known as a capability model, provides a high-level abstract representation of the capabilities possessed by an organization. These capabilities enable the organization to deliver products and services, each of which offers value to customers.
BCM shows what the organization can do, not how, who or where this is done. It provides a static view and does not show the movement of work, materials, or data.
In principle, there should be only one business capability model for an organization (or business domain under study) with each capability rationalized into a unique definition. The model covers the entire scope of the organization.
When an organization works with external suppliers and partners to deliver its products or services, the business capability model represents the capabilities that are available across the entire ecosystem.
Defining a BCM helps businesses respond to changes in the business environment effectively and rapidly by being able to assess more accurately the impact and difficulty level of any proposed changes earlier and before too many resources have been expended.
Following guidelines must be followed for producing a BCM:
- Capabilities must always be defined in business terms.
- Capabilities must be at a higher level of abstraction than the actual end-to-end business processes that support them.
- Capabilities should always be named using a noun/noun structure (for example, ‘complaint management’ rather than ‘manage complaint’).
- Capabilities must be unique across the entire capability model.
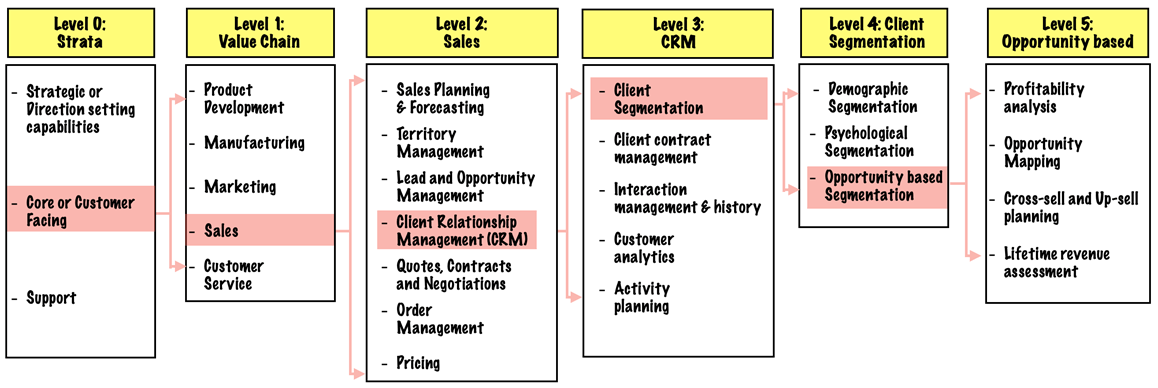
BCM is represented as a hierarchical taxonomy and is developed using the following approach:
- Foundation-level capabilities are first identified within each of the three main strata. (In the example below, Sales is identified under Core/Customer-facing capability).
- The foundation-level capabilities are expanded and the lower-level capability groups they contain are identified (Sales is an agglomeration of 7 level 2 capabilities in the example below).
- The re-usable standalone business capabilities within the capability groups emerge and are added to the model (Levels 3, 4 and 5 in the example below).
Irrespective of the level of definition for capabilities, the acronym SUAVE helps to ensure that they are described well and consistently:
- Stable: The capability should represent the essence of the business, which does not change significantly over time.
- Unique: The capability should be distinctive and not duplicated across the organization. Each capability must occur once in the model; this encourages a standard implementation of the capability across the organization.
- Abstracted: The capability should not be concerned with the detailed process, people and technology required to conduct the work.
- Value–driven: The capability should be focused on the delivery of service to the end customer.
- Executive: The capability should be of interest to the organization’s management.
In a Gap Analysis, each subsequent decomposition of a capability provides a more granular view of what a business can do. This helps highlight where the gaps are and to identify which changes may not be feasible.
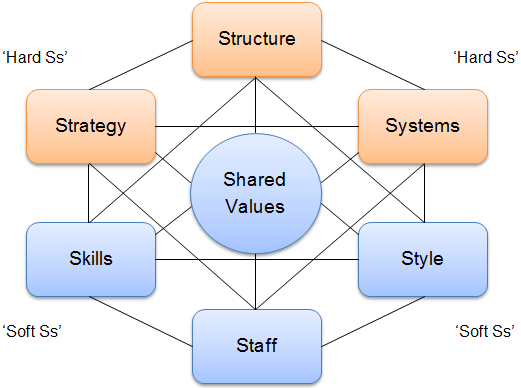
12. McKinsey’s 7S model
The 7S model[27] provides a representation of seven elements that collectively make up an organization. These seven elements offer different perspectives that may be analyzed to identify areas for improvement or gaps when implementing business change.
Three elements – strategy, structure and systems are often described as ‘hard’ because they are tangible, and four elements – shared values, style, staff and skills are described as ‘soft’.
All seven elements require attention if changes are to be executed successfully because where one element changes, others are inevitably affected.
The elements are described below:
Structure: This is the organizational management structure which includes functional, divisional, matrix and virtual structure. Structures may be centralized or decentralized, flat or tall. Each structure determines how information is communicated and distributed and where management responsibilities lie.
Systems: The processes, tasks, procedures, applications, and data that enable the organization to carry out its work. This element is considered within the Processes POPIT dimension (processes, tasks and procedures) and the Information and Technology dimensions (applications, data).
Style: The leadership approach adopted by senior executives. Possible styles include collaborative or directive.
Skills: The skills of the people within the organization and the capabilities of the organization itself. People skills are covered within the People POPIT dimension, while capability is part of the Business Capability Model.
Staff: The type of people employed within the organization and how they are appraised and developed. This is covered within the People POPIT dimension.
Shared values (also known as ‘superordinate goals’): This dimension concerns the values, beliefs and behavioral norms of the organization or business area. They are the guiding concepts and fundamental ideas of the organization.
Strategy: The actions that an organization decides upon to respond to changes in its external business environment. These changes may include actions taken by competitors or new requests from customers. Strategy concerns the planned approach an organization adopts in order to improve its competitive position.
While performing a Gap Analysis, key aspects of the McKinsey model are not only the individual elements but the lines that connect them.
For example, unless the shared values are explicit and communicated, they will not effectively drive other areas, such as the systems and structures. Likewise, the style reflected by the management approach and culture also needs to be in line with the values and the strategy.
Sources
1. “Business Analysis”. Debra Paul, James Cadle, Malcolm Eva, Craig Rollason, and Jonathan Hunsley, https://www.amazon.in/Business-Analysis-Debra-Paul/dp/1780175108. Accessed 08 Aug 2023
2. “Business Analysis Techniques 123 Essential Tools for Success”. James Cadle, Debra Paul, Jonathan Hunsley, https://www.google.co.in/books/edition/Business_Analysis_Techniques/TnN1zgEACAAJ?hl=en. Accessed 06 Aug 2023
3. “Do We Need a Mature GAP Analysis?”. Business Analyst Times, https://archive.ph/20130120053323/http://clients.criticalimpact.com/go.cfm?a=1&b=190498&c=24428&f=7027524de51ceed3ef5797149eaa845b522d9f0eaa681b4f#selection-639.76-669.6. Accessed 06 Aug 2023
4. “The Complete Guide to Gap Analysis”. Smartsheet.com, https://www.smartsheet.com/gap-analysis-method-examples. Accessed 06 Aug 2023
5. “MOST Analysis – What It Is and How to Use It”. Business Analyst Mentor, https://businessanalystmentor.com/most-analysis/. Accessed 06 Aug 2023
6. “Task Analysis”. U.S. Dept. of Health and Human Services, https://www.usability.gov/how-to-and-tools/methods/task-analysis.html. Accessed 08 Aug 2023
7. “U.S. Dept. of Health and Human Services”. Prototyping, https://www.usability.gov/how-to-and-tools/methods/prototyping.html. Accessed 08 Aug 2023
8. “What Are Wireframes?”. Balsamiq, https://balsamiq.com/learn/articles/what-are-wireframes/. Accessed 08 Aug 2023
9. “Website wireframe”. Wikipedia, https://en.wikipedia.org/wiki/Website_wireframe. Accessed 08 Aug 2023
10. “Use Cases”. U.S. Dept. of Health and Human Services, https://www.usability.gov/how-to-and-tools/methods/use-cases.html. Accessed 08 Aug 2023
11. “Use case model of a restaurant business”. Wikipedia, https://commons.wikimedia.org/wiki/File:Use_case_restaurant_model.svg. Accessed 08 Aug 2023
12. “User stories with examples and a template”. Atlassian, https://www.atlassian.com/agile/project-management/user-stories. Accessed 08 Aug 2023
13. “Chapter 15: Requirements and user stories”. Agile Business, https://www.agilebusiness.org/dsdm-project-framework/requirements-and-user-stories.html. Accessed 08 Aug 2023
14. “Mind map”. Wikipedia, https://en.wikipedia.org/wiki/Mind_map. Accessed 06 Aug 2023
15. “Mind map – Gallery”. Wikipedia, https://en.wikipedia.org/wiki/Mind_map#Gallery. Accessed 06 Aug 2023
16. “Tony Buzan”. Wikipedia, https://en.wikipedia.org/wiki/Tony_Buzan. Accessed 07 Aug 2023
17. “Ishikawa diagram”. Wikipedia, https://en.wikipedia.org/wiki/Ishikawa_diagram. Accessed 09 Aug 2023
18. “Rich Pictures”. Pete Johnson & Alexandra Penn , https://link.springer.com/chapter/10.1007/978-3-031-01919-7_2. Accessed 08 Aug 2023
19. “What Is Business Process Modeling?”. IBM, https://www.ibm.com/blog/business-process-modeling/. Accessed 08 Aug 2023
20. “What is Unified Modeling Language”. Lucidchart, https://www.lucidchart.com/pages/what-is-UML-unified-modeling-language. Accessed 07 Aug 2023
21. “BPMN 2.0 Symbol Reference”. Camunda, https://camunda.com/bpmn/reference/. Accessed 07 Aug 2023
22. “A running example of a BPMN diagram”. Peter Y. H. Wong, https://www.researchgate.net/figure/A-running-example-of-a-BPMN-diagram_fig3_295135730. Accessed 07 Aug 2023
23. “POPIT Model – Four View Model | Taking a Holistic Perspective”. Business Analyst Mentor, https://businessanalystmentor.com/popit-model/. Accessed 08 Aug 2023
24. “INTRODUCTION TO THE BUSINESS ACTIVITY MODEL (BAM)”. Improvement Service, https://www.improvementservice.org.uk/business-analysis-framework/consider-perspectives/business-activity-models-bam. Accessed 08 Aug 2023
25. “INTRODUCTION TO CATWOE”. Improvement Service, https://www.improvementservice.org.uk/business-analysis-framework/consider-perspectives/catwoe. Accessed 07 Aug 2023
26. “Capablity Model”. CIO Pages, https://www.ciopages.com/capability-model/. Accessed 07 Aug 2023
27. “McKinsey 7S Model”. Strategic Management Insight, https://strategicmanagementinsight.com/tools/mckinsey-7s-model-framework/. Accessed 08 Aug 2023