“Whenever there is a product for a customer, there is a value stream. The challenge lies in seeing it.”
Mike Rother and John Shook – Learning to see[1]
What is Value Stream Mapping (VSM)
Value Stream Mapping (VSM) is a pencil-and-paper tool that helps see and understand the flow of material and information as the product makes its way through the value stream. It presents a holistic and visual way to deeply understand how work gets done and to design an improved future state.
The roots of value stream mapping can be traced to a visual mapping technique used at the Toyota Motor Corporation known as “material and information flow”.
The term value stream was coined by James Womack, Daniel Jones, and Daniel Roos in the book ‘The Machine that Changed the World (1990)’.[2] The tool was further popularized by James Womack and Daniel Jones in Lean Thinking (1996).
Why use Value Stream Mapping
A value stream is the sequence of activities an organization undertakes to deliver on a customer request. To reap the greatest gains from viewing work and organizing the business according to value streams, it becomes necessary to analyze and improve each product family’s value stream.
VSM is a tool that helps achieve this by visualizing complex work systems so that any disconnects, redundancies, and gaps in the workflow can be effectively addressed.
A well-executed VSM helps organizations see ample transformational opportunities that have long-lasting and deeper benefits. Such a transformation requires fundamental changes in an organization’s DNA and VSM can be instrumental in facilitating the necessary shifts in mindsets and behaviors.
Some of the key benefits of VSM are:
Providing strategic direction:
Work often has various degrees of granularity, and VSM provides the macro perspective and the means for leadership to define strategic improvements.
When organizations see the interconnectedness of various departments and processes, they make better decisions, work together in more collaborative ways, and avoid the common and costly trap of suboptimization.
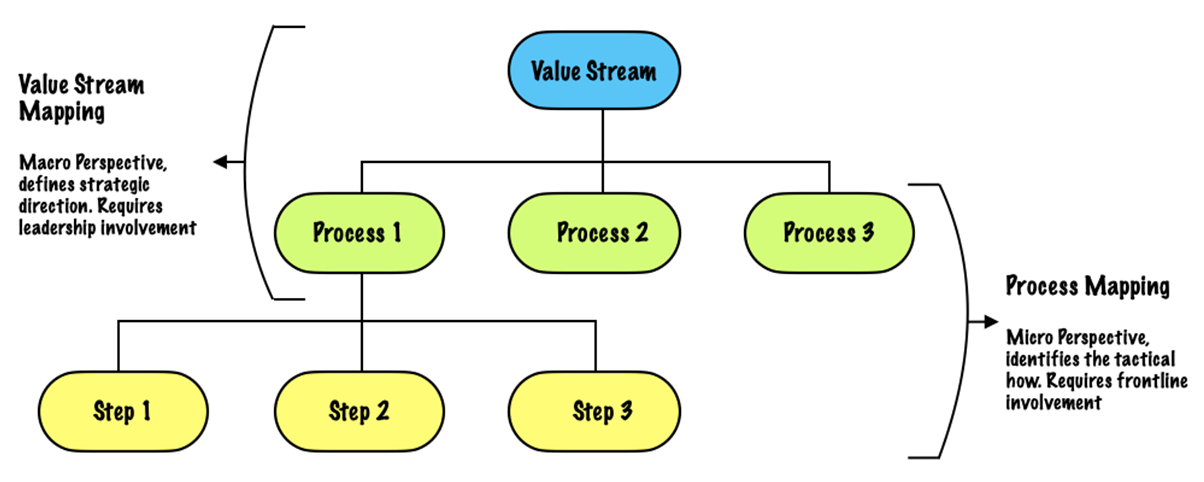
A value stream map is different from process-level maps[4], which are commonly used by organizations to enable frontline people to design tactical improvements. VSM, in contrast, is used at a macro level and involves leadership participation.
VSMs connect disparate parts of an organization into one whole with a singular goal: providing higher value to its customers.
A visual unification tool
VSM provides a highly visual, full-cycle view (a storyboard) of how work progresses from a request of some sort to fulfilling that request. It places the customer in a central position, which provides a powerful means to view an entire work system as it relates to delivering customer value.
VSM’s visual depiction of the cycle typically includes three components:
- Information Flow
- Workflow
- Timeline
VSM’s ability to visualize non-visible work brings clarity about and consensus around how work gets done. This is particularly useful for visualizing how IT systems and applications enable (or don’t enable) the provision of value to customers. In such a setting, VSM reveals the disconnects, redundancies, and unnecessary complications that otherwise aren’t apparent.
Deepens organizational understanding
VSM enables a deeper understanding of the organizations’ work systems that deliver value and support the delivery of value to customers. This aids in better decision-making and work design.
VSM distills complex systems into simpler and higher-level components that can be understood by everyone from senior leaders to the front lines. This helps create common ground from which to make decisions.
Quantitative in nature
The quantitative nature of VSM provides the foundation for data-driven, strategic decision-making. By measuring overall value stream performance and identifying barriers/process breakdowns in the workflow, VSM drives continuous improvements. Organizations are better able to meet their customer’s needs as well as internal needs.
Placing Customer at the center
VSMs provide a clear line of sight to the external customer from every function and work area involved in the value stream. Many organizations are structured as a series of function-based silos that bear little relationship to the customer fulfillment cycle:
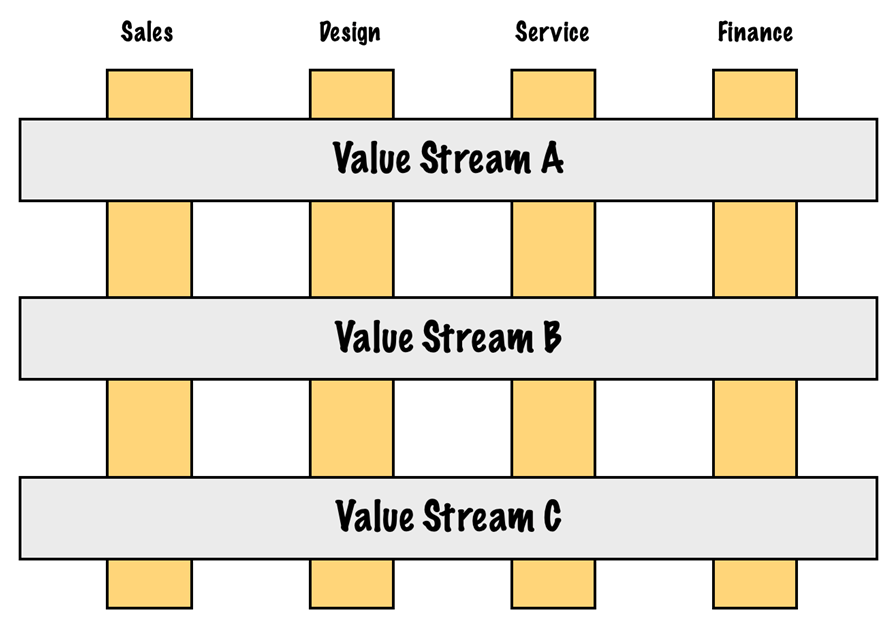
VSMs force an organization to think holistically in terms of cross-functional work systems and product families. This degree of clarity helps an organization make the transition from internally focused thinking to customer-focused thinking, which is the foundation for providing greater value.
A simplification tool
For many organizations, creating visual storyboards is the first time that any one person gets to understand the entire workflow. VSM, done well, develops that degree of insight in many.
“If you can’t describe what you are doing as a process, you don’t know what you are doing.”
Edward Deming[5]
Every organization needs to cope with increasingly high degrees of variation in customer types, needs and expectations. Product customization is also on the rise, making the process and their interconnectivity very complex.
In such a scenario, VSMs become even more relevant as a tool for visualizing and simplifying how work gets done at a macro level to make better and faster strategic decisions.
A way of continuous improvement
VSM is an important step in using the Plan-Do-Study-Act (PDSA)[6] cycle to solve performance issues, capitalize on market opportunities, plan new product lines, and improve existing ones.
A future state VSM provides a strategic framework using which tactical improvement can be planned. Acting as a blueprint of an organization’s functions, they drive discussions and decision-making at all levels.
Prerequisites for Value Stream Mapping
Ideally, an organization seeking transformation using VSM must have the following:
- A clearly defined purpose.
- A consensus around its strategic direction.
- Clearly defined business goals.
- Alignment around a limited number of improvement priorities.
Without the above, an organization must first undertake Strategy Deployment[6] to define and gain consensus around its priorities needed to realize business goals. Strategy deployment enables the creation of an action plan that focuses on a limited number of problems to be solved and/or opportunities to be leveraged. With it, the value streams to be improved become obvious.
A full value stream investigation must be carried out if an organization experiences eroding margins, faces new competition or market share loss, or wishes to improve operations to increase market value.
The bottom line – where to begin and when to map depends on organizational maturity and experience. Less experienced organizations may begin by identifying a value stream that could benefit from improvement, isn’t too complex, has a motivated executive sponsor, and is highly visible.
More mature organizations may want to conduct value stream mapping as part of their strategy deployment process.
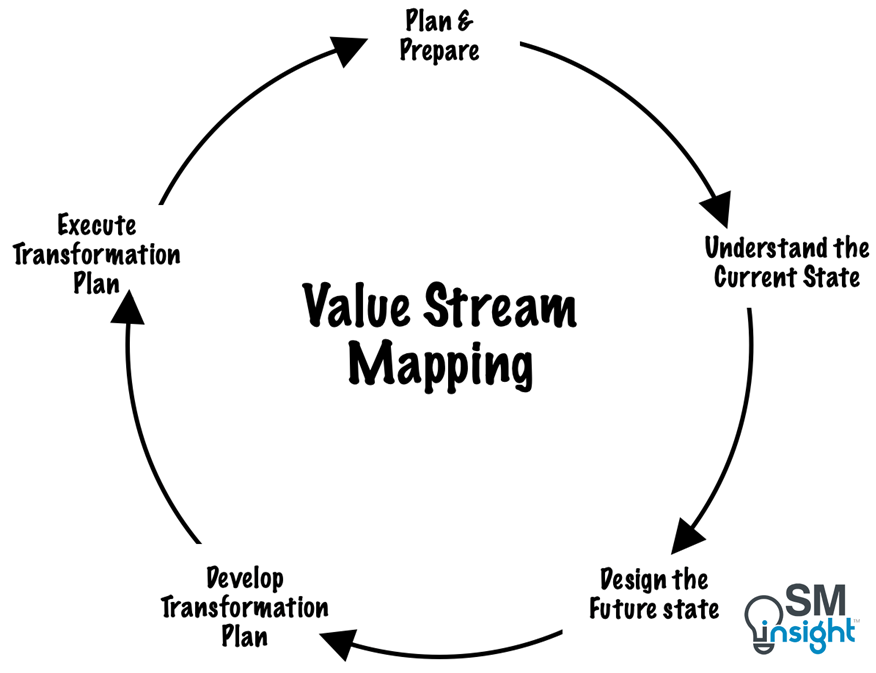
Stages of Value Stream Mapping
Value Stream Mapping consists of five stages, as shown:
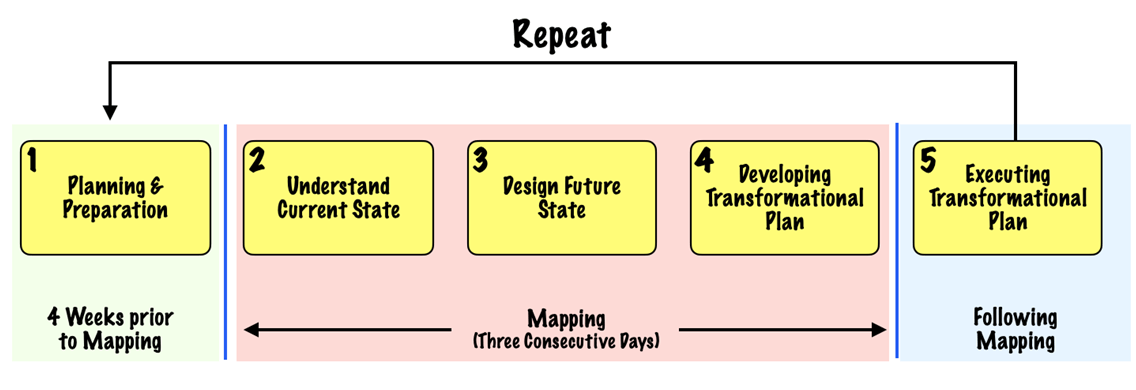
The mapping activity (as shown) results in three deliverables:
- A Current State Value Stream Map,
- A Future State Value Stream Map,
- A Value Stream Transformation Plan
Each of the five stages in VSM is as described:
VSM Stage 1: Planning and Preparation
The key goal in the planning and preparation stage is to set the stage that enables successful VSM implementation and consists of the following steps:
Laying the groundwork
Individuals in most organizations operate at such a micro level that it becomes difficult for them to see how the entire work system fits together. From culture to organizational readiness to the mechanics of VSM, many factors need to be considered before VSM can begin. This involves the following:
- Provide an overview of VSM to the mapping team and leadership.
- Imparting a foundational understanding of Lean principles and common countermeasures.
- Including leadership from support functions like HR, IT, and Finance so that see the interconnectedness and the benefits of viewing work through a value stream lens.
- To make sure every leader understands the organization’s key value streams and how the individual and his team support in delivering value to external customers.
Laying the groundwork involves developing an overview which includes indoctrination of:
- What value streams are.
- The purpose of value stream mapping.
- What benefits it offers.
- How it’s done.
- What effect the activity will have on the organization.
This helps to set context and expectations, clarify scope, define roles and responsibilities, establish the rules of engagement, and address logistics. It also exposes middle managers and front-line workers to the concept of value streams and results in informed decision-making and lower resistance to change.
Developing a value stream mapping charter
The success of VSM is dependent on good planning, which is effectively and efficiently reflected in a charter. The charter serves a fourfold purpose:
- Planning
- Communication
- Alignment
- Building Consensus
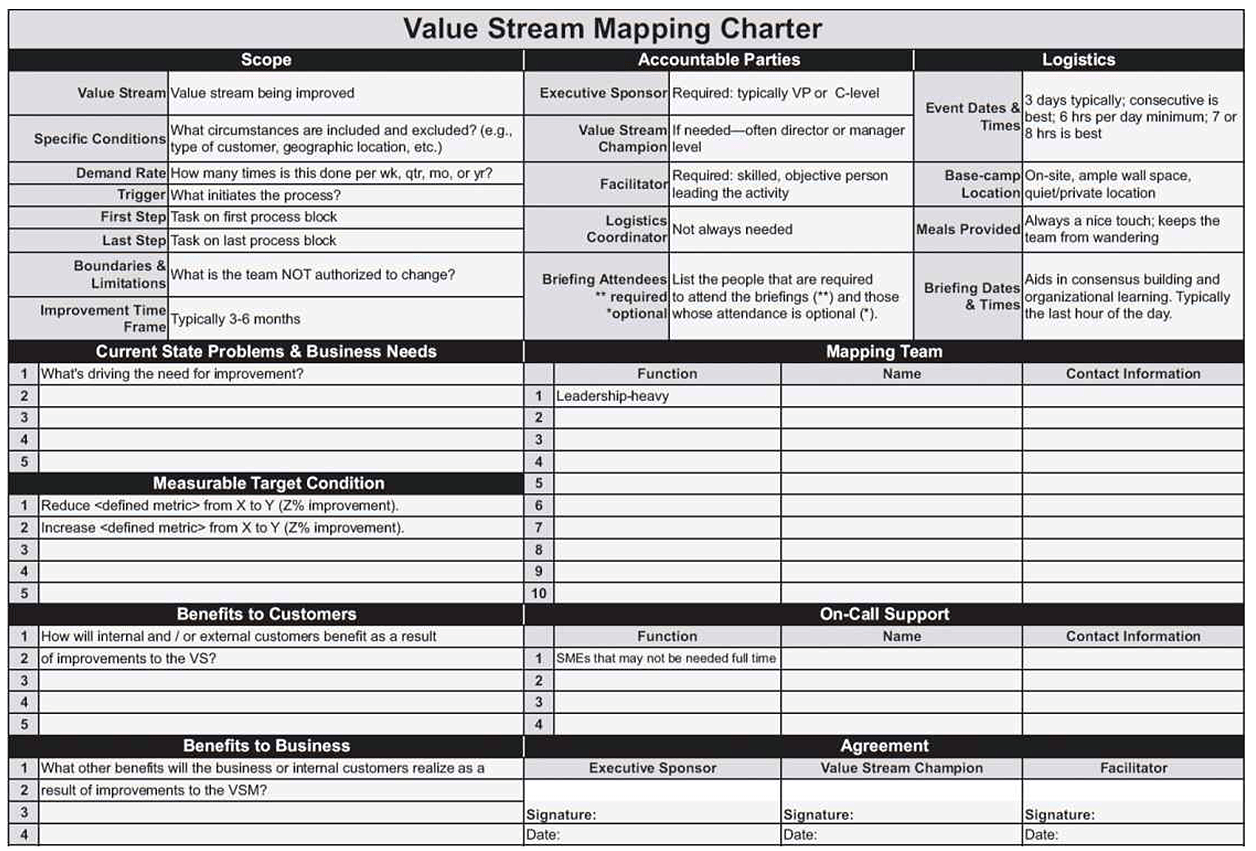
Value Stream Charter consists of the following components:
Scope: defines the parameters of the mapping activity and helps ensure that the right people are included in the team and that everyone understands what the mission is.
The scope includes the following information:
- Value Stream: Describes the value stream to be mapped. It could be a full customer-facing value stream or a value stream segment (a portion of a larger value stream) or a value-enabling (support) value stream that doesn’t provide a good or service directly to an external customer.
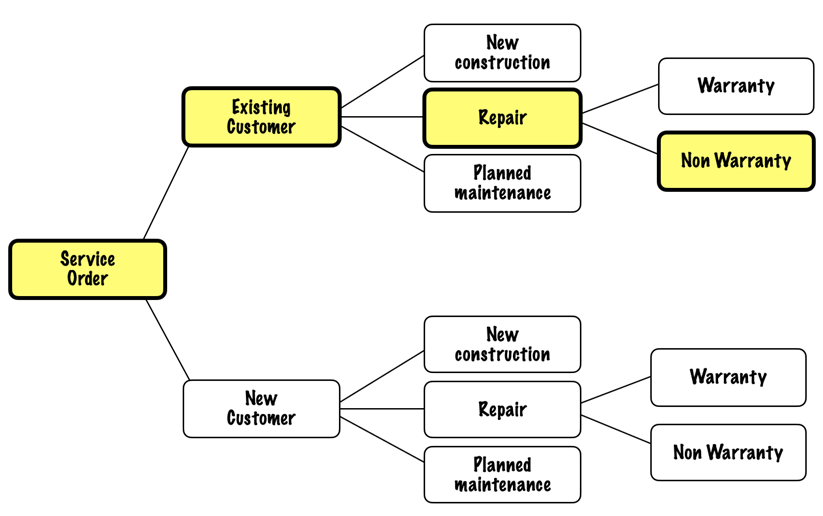
- Specific Conditions: Lays out a specific set of conditions that will be included or excluded in the mapping activity. This avoids the risk of losing time trying to understand all possible variations and not getting to understand how the workflows.
 The variants with thick borders reflect the specific conditions the team will focus on. (Source: Value Stream Mapping[3])
 The variants with thick borders reflect the specific conditions the team will focus on. (Source: Value Stream Mapping[3])
- Demand Rate: This is the volume of incoming work for a given period (per day, week, month, or year). Without this data, it is impossible to understand current state performance, the volume and types of work flowing through a system.
- Trigger: the thought or action that initiates work flowing through the value stream. It can be a customer decision, an external occurrence of some sort, a scheduled activity, or some other action.
- First Step, Last Step: the “fence posts” between which the team will focus its attention. Occasionally, situations call for adjusting fence posts during the mapping activity but it is always desirable to have clarity up front.
- Boundaries and Limitations: include the decisions and actions that the team is not authorized to take. They could be financial, systems-related, customer or market-specific, staff or organizational in nature, or physical.
- Improvement Time Frame: the time frame for executing improvements to realize the future state design. A shorter-term (3-6 months) approach is preferred over long-term as the latter is at a greater risk of stalling due to distractions, shifts in leadership priorities, and changing conditions in technology, marketplace, regulatory environment etc.
Current state problems and business needs: This involves taking the time to identify, gain consensus around, and succinctly communicate the top two to five reasons for tackling improvement across an entire value stream.
When done right, this saves significant time during and after the mapping activity, as people are already convinced of the need for change.
Measurable Target Condition: defines how aggressively the team plans to improve and depicts the current state and the future state using raw numbers, for example, from X to Y. It must also include the percentage of improvement.
Benefits to customers and benefits to business: Listing two to five direct and collateral (indirect) benefits to both the organization and its customers paves the way for reduced resistance to change, accelerated execution of improvements, and a “big picture” understanding from the front lines to senior leaders.
Accountable Parties: for the success of VSM improvement, designated people serving in defined roles with clear responsibilities are a must. This requires at least an executive sponsor and a facilitator, among the other roles defined below.
- Executive Sponsor: typically, a vice president, plant or general manager, or C-level leader who’s ultimately accountable for the results. He/She must have the greatest degree of “skin in the game” and must carry strong influence and enthusiasm.
- Facilitator: serves varied roles that range from teacher to timekeeper and from skilled change agent to provocateur. They must be comfortable with conflict, possess strong listening skills, and must be equally proficient at leading a team through the discovery, design, and planning phases of the mapping activity.
- Value Stream Champion: accountable for the performance of the entire value stream and, in a hierarchical organization, is a step or two closer to the work than the executive sponsor.
- Logistics Coordinator: One responsible for the day-to-day support activities, making sure the working team has all the resources they need.
Logistics: Includes logistics information such as the dates and times for the mapping activity, the location of the “base camp” from which the mapping team will operate, dates and times for briefings etc.
Mapping Team: a list of the mapping participants. Ideally, five to seven participants, who represent functions that play a significant role in the process, provide the best result. In some cases, additional “subject-matter experts” may be required on the team, but in no case should the team have more than ten people.
The team should also be heavily biased with leadership (typically managers and above) who can influence and authorize future state improvements needed to transform the value stream.
On-call support: Parties who either play a very minor role in the value stream or provide indirect support to one or more areas in the value stream. These leaders are often required for the briefings but are not needed full-time on the team.
Agreement: having a signed agreement depends on an organization’s culture and maturity. Signatures from the executive sponsor, value stream champion, and facilitator show commitment to the mapping activity and subsequent value stream transformation.
Socializing the value stream mapping charter
Charter socialization lays the groundwork for the successful execution of improvements and reduces the risk of obstacles that may otherwise arise months after the actual mapping activity. It involves engaging three groups in understanding the charter:
- Affected leadership.
- The mapping team members.
- The workers in the areas that will be included in the value stream walk.
These groups must be made fully aware of the why, what, how, and when of the value stream mapping. A safe environment for honest exchanges must be established.
Collecting data
Up-front data collection depends on the nature of the value stream being mapped, improvement drivers, and defined target conditions. The most common forms of data include:
- Current and forecasted customer demand for one to two years so that the future state design accommodates increased growth or shrinkage.
- Quality reports that quantify internal or external issues
- Demand patterns, service levels, lead times, and productivity for data-rich, high-volume processes
- Quantity of work-in-process (queued work) at each process throughout the value stream.
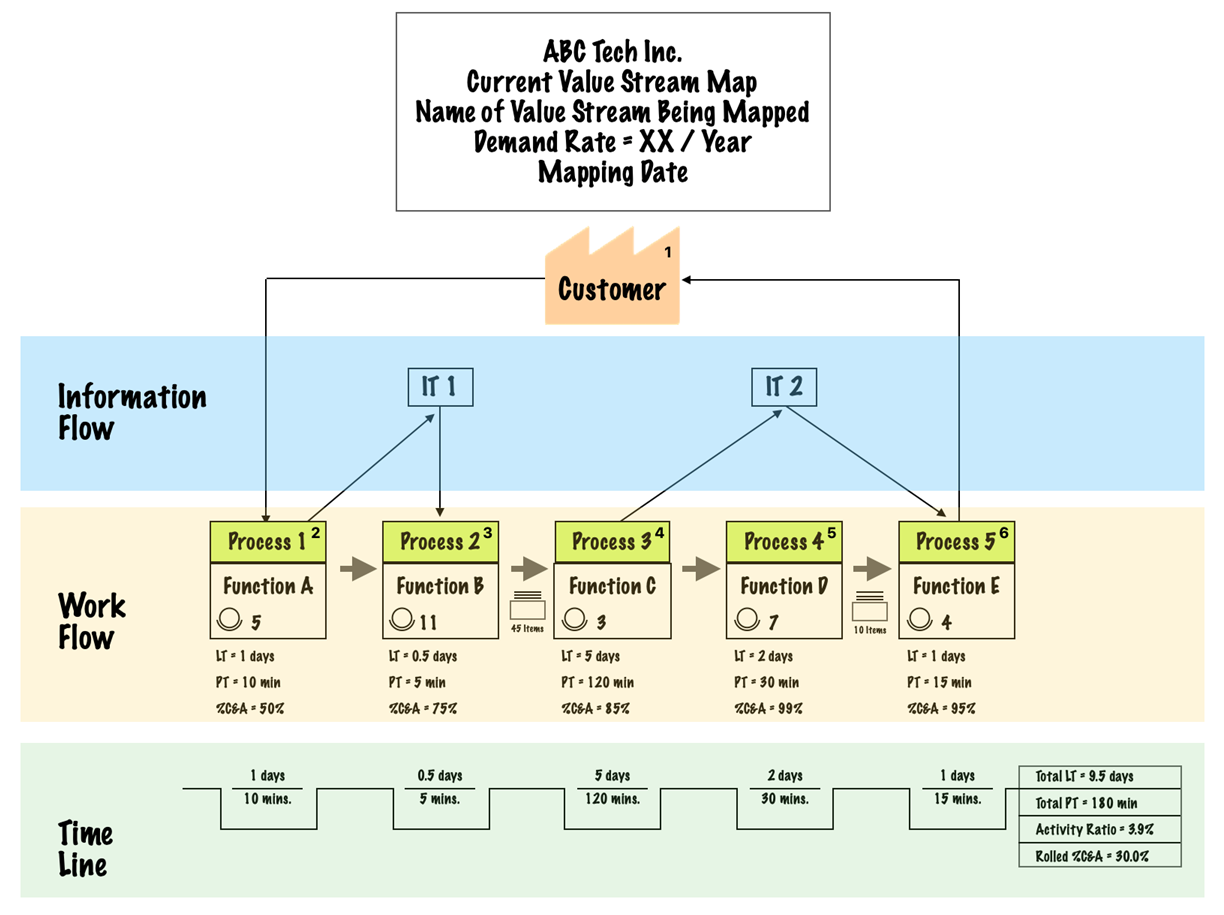
VSM Stage 2: Understanding the current state
The Current State Value Stream Map (CS-VSM) enables everyone in the organization to see the truth about how the value stream is performing. It achieves a larger purpose of building consensus and accelerating improvement. Changes are met with less resistance when it’s based on facts, as opposed to differing perceptions and opinions.
CS-VSM is a visual storyboard that shows how the work currently gets done. It represents how work flows, who does what, and how the value stream is performing.
When people describe a specific process in a value stream, at least four different versions emerge:
- How Managers Believe It Operates.
- How It Is Supposed To Operate (Written Procedures, SOPs, etc.).
- How It Really Operates.
- How It Could Operate.
CS-VSM must always focus on how the work is being performed in the environment at that particular moment. Hence, it must always reflect the value stream as it existed on the day on which it was mapped.
Understanding the current state requires the following steps:
Activity Kickoff
Beginning with team introductions (even if the team know one another), Activity Kickoff consists of:
- Identifying roles in the value stream – highlights the interconnected nature of the work and shifts mindsets from siloed thinking to holistic thinking.
- Sharing expectations and/or concerns about the three-day mapping activity.
- Discussing disconnects in expectations vs approved charter (if any)
- Address by the Executive Sponsor to reiterate business drivers for improving the value stream
- A review of the charter to ensure that the team is clear about the scope and its mission.
- Briefing by the Facilitator on the ‘notional’ agenda and the rules of engagement. (Notional because the agenda should have a little flexibility).
The team ideally constructs the CS-VSM on a 36-inch-wide paper. During the Kickoff stage, information such as value stream name, “current state,” included and/or excluded conditions, customer demand (work volume), the names of the sponsor and mapping team members, and the date may be recorded.
First Walk
This step involves physically walking the value stream and is also known as “going to the Gemba.” Gemba is a Japanese term that means “the real place where the work is actually done”.
It allows the team to observe the work, talk to the workers in their environment, and learn about obstacles to flow firsthand. For a value stream walk to be effective, it is important that the workforce understands the focus is on work systems design, not individuals’ performance. The environment must encourage them to speak candidly without fear.
The first value stream walk focuses on obtaining the most basic information needed to understand the current state. This could include details such as:
- The sequence of processes that connect to form the value stream
- Functions that perform the work. (Ex, a customer service rep may enter an order).
- Gaining a high-level understanding of what’s being done to transform an input into an output. VSM is only concerned with a macro-level picture, hence the granularity and the specific steps are irrelevant.
After the initial walk, the team returns to base camp, compares notes, and reaches a consensus about the process blocks that will be on the map as well as their sequence.
Mapping layout after the first walk
This step involves building a rudimentary view of the value stream on the mapping paper. The team focuses on the basics, such as what is done, who does it, and in what order.
Views related to customers, whether external or internal, are typically placed in the top center position on the map. If the value stream involves outside suppliers, then the customer views are placed in the upper right of the maps and the supplier in the upper left, as shown:
![Image Source: Creately.com[7]](https://strategicmanagementinsight.com/wp-content/uploads/mapping-layout.png)
Next, the team agrees on the process blocks that will form the value stream. To aid in targeting the right level of information, typically, 5 to 15 serial process blocks are ideal. While fewer than five processes may not reflect enough detail, having more than 15 serial process blocks is an indication of an excessively broad scope.
The goal is to stay at a strategic level which enables spotting performance gaps with ease.
Once the team members agree on the process blocks, descriptions of its activities are written with the fewest words possible in a verb-plus-noun format (Ex: e.g., test specimen, interview candidates, enter order, etc.). The process blocks are then numbered for easy reference.
Second Walk
The goal of the second value stream walk is to gain a deeper understanding of the current value stream’s performance (both time and quality) and identify significant barriers to flow.
The following three metrics are most relevant to evaluate the current state of most value streams:
Process Time (PT): also referred to as processing time, touch time, work time, or task time, it is the time it takes people to complete the process tasks to transform an input into an output for one unit of work.
It is typically expressed in minutes or hours. It represents the hands-on “touch time” to do the work – the time it would take to do the work if the process workers could do just that uninterrupted.
The activities included in the Process Time are as shown:
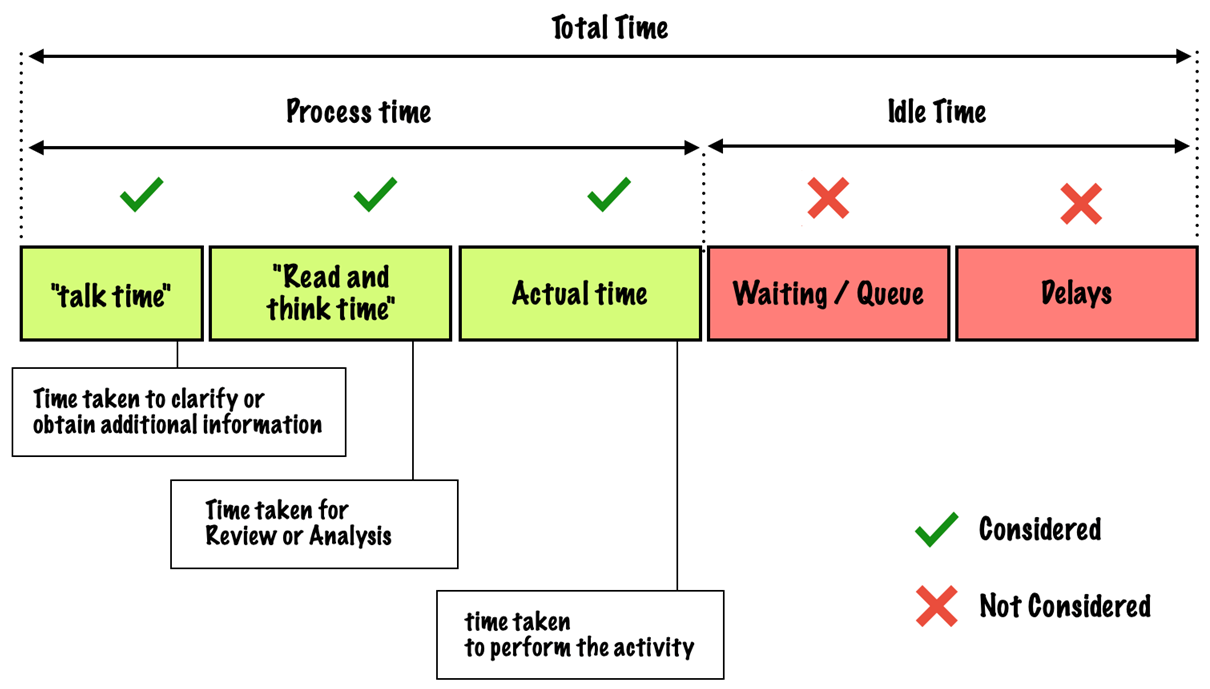
Process time reflects human effort (and, sometimes, equipment time). In the current state, it consists of both value-adding as well as non-value-adding efforts. The latter could include pure non-value-added effort (waste) or it could also include value-enabling activities.
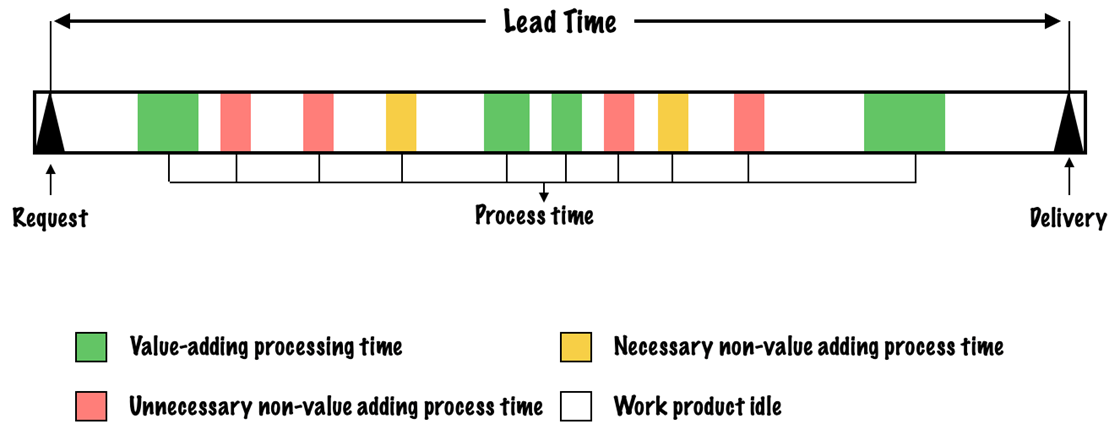
Lead Time (LT): it is the elapsed time from the moment work is made available to an individual, work team, or department until it has been completed and made available to the next person or team in the value stream.
It is also referred to as throughput time, response time, and turnaround time and includes the queue time and delays plus process time as shown:
Percent Complete and Accurate (%C&A): reflects the quality of each process’s output. It is obtained by asking downstream customers what percentage of the time they receive work that is error-free – meaning there is no need to correct the information, add missing information, or clarify.
For example, if a department reports that people must correct, add missing information, or clarify 30 percent of the time, then the %C&A is 70%.
In addition to the three metrics, the team may also make additional observations, including barriers to flow and process-specific observations:
Identifying Barriers to Flow: these are actions or conditions that inhibit the uninterrupted progression of work. Excessive lead times are an indication that there are “flow stoppers” or barriers to flow. Some examples include:
- Batching: Idle time when waiting for optimum batch size. Batching primarily occurs due to two reasons: (1) batch size holding work until a specific number of items have accumulated, (2) batch frequency – performing an activity at a specific time of day, week, or month.
- System Downtime or Suboptimal Performance: Excessive system downtime and/or slow responsiveness if observed must be recorded during value stream walks.
- Shared Resources or Inaccessible Staff: People and resources unavailable to do the work as soon as it arrives due to multiple obligations and priorities.
- Switch-Tasking / Interruptions: Frequently switching tasks, frequent interruptions, and changeover in manufacturing environments.
- Prioritization Rules: Differing and/or conflicting prioritizing rules could cause barriers.
Additional Information: a wide range of potential information may be relevant for gaining a deeper understanding of a value stream’s current performance, such as:
- Work-in-Process (WIP) – accumulation of work between or within processes.
- Number of People.
- Number of Hours Worked.
- Process effectiveness – % upstream work that converts into downstream work.
- Work Volume or Demand Rate at Each Process.
- Work Trigger – how people know when to start.
If any of the above additional information is relevant at a macro level, it must be recorded during the second walk.
Mapping layout after the second walk
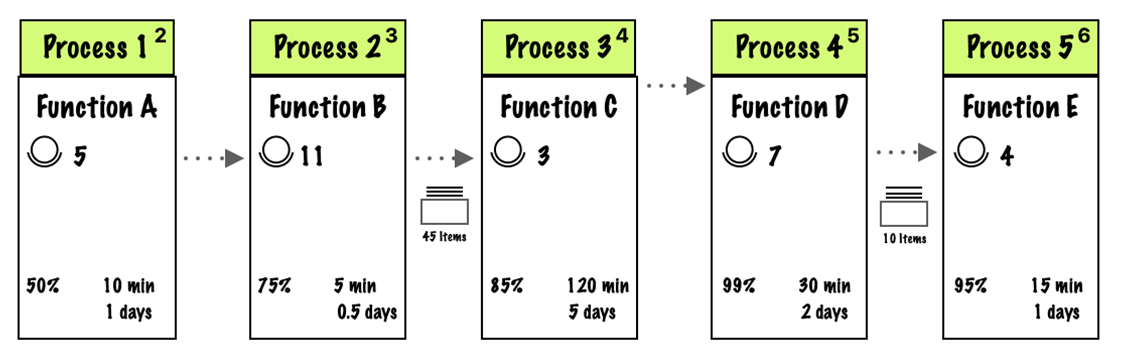
Mapping Process Blocks: This involves adding the information obtained during the second walk to the process blocks on the map. The figure below illustrates the conventions used for positioning metrics, barriers to flow, and other information on the blocks:
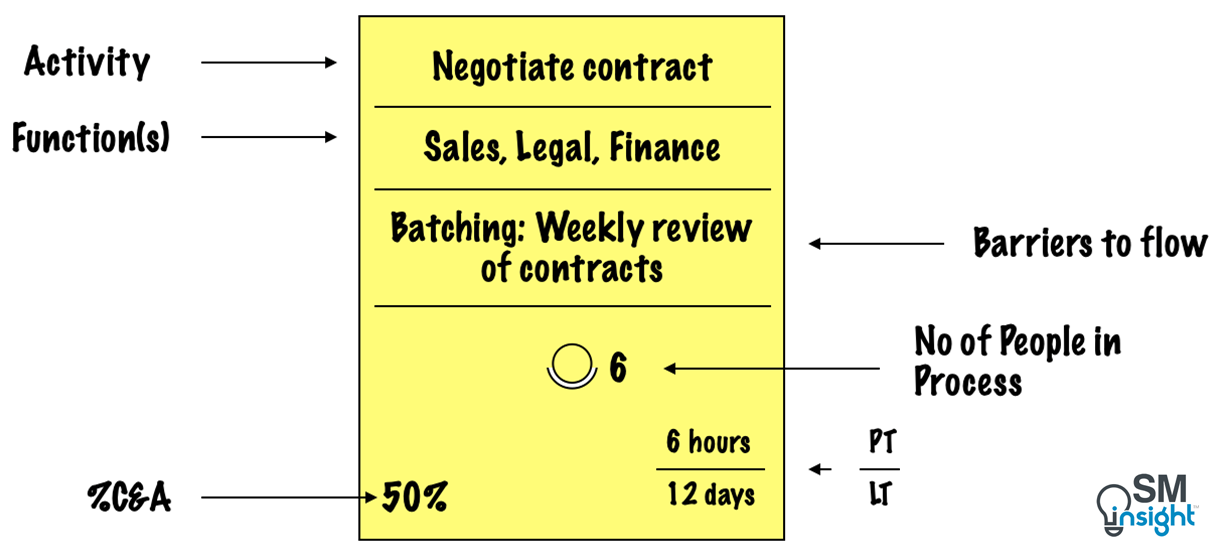
It is important to include the units for PT and LT which must later be converted to the same units. If multiple downstream customers report quality issues with incoming work, the team should note each customer’s perspective as shown:
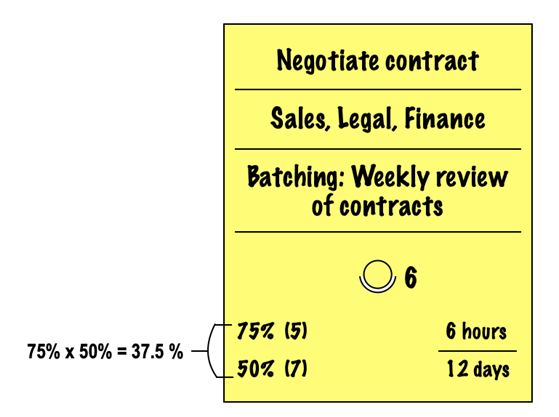
Accumulated work-in-process (WIP), if any, is placed on the map to the left of the process using an in-box icon. Each of the process blocks is then joined by the dashed push arrows (or pull arrows) depending on whether the work is pushed or pulled.
Mapping Information Flow: The systems and applications that each process in the value stream interfaces with are shown to understand how information flows across the value stream. To make effective improvements, a CS-VSM must visually bring out the technology-related disconnects, voids, and redundancies that may exist.
Information block that includes the names of all IT systems and applications in use across the value stream is depicted in between the customer block and the process blocks as shown:
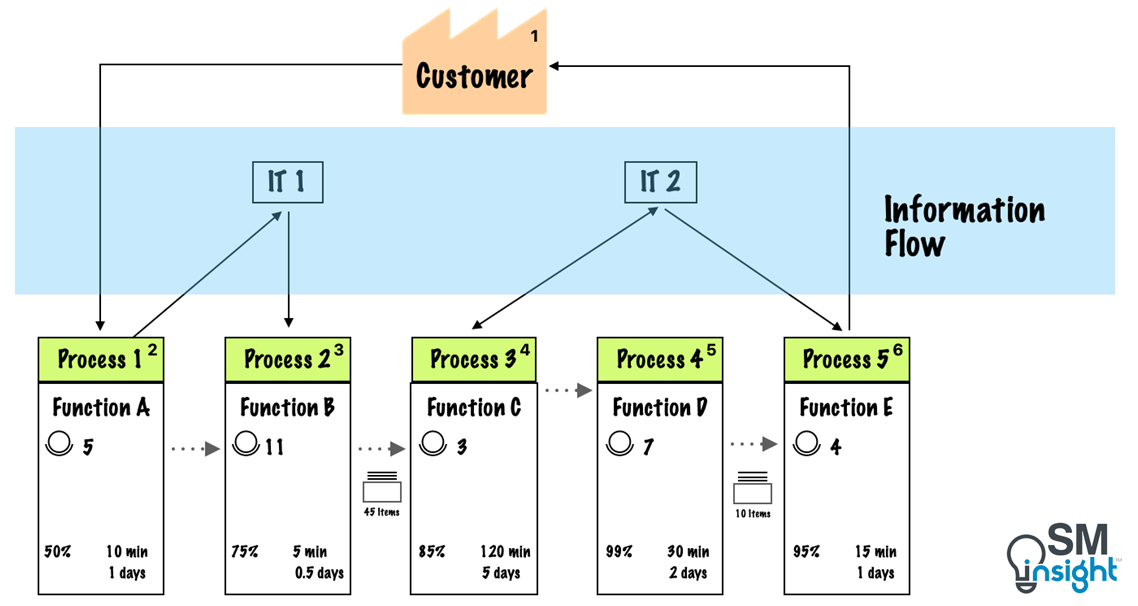
IT systems and process blocks are then connected with arrows, where the head of the arrow indicates the direction of the information flow. The flow of information could also be bi-directional.
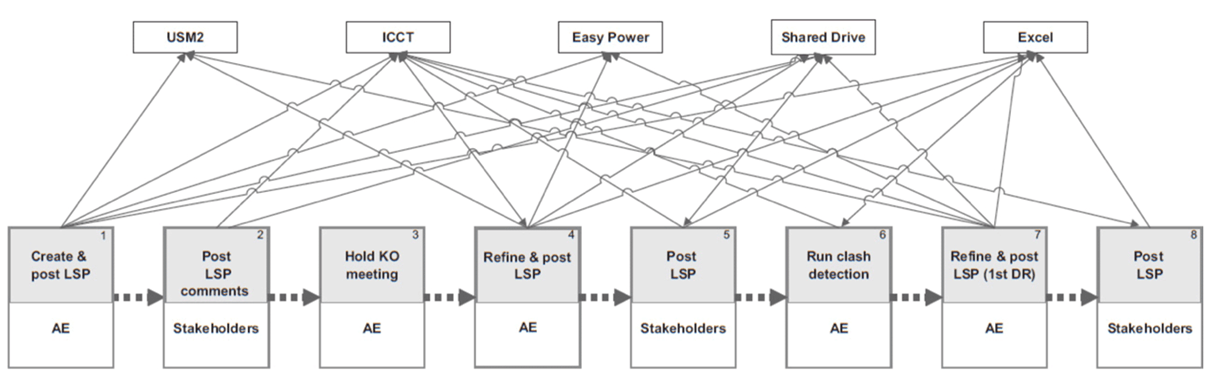
Mapping information flow can bring out the overly complicated nature of their information systems and highlight instances of overprocessing, errors, and operational chaos caused by the disconnections, gaps, and redundancies.
Mapping the Summary: Last step in CS-VSM is to create a timeline that demonstrates the degree of flow present, the speed at which an organization delivers goods or services to the customer, and the amount of work effort involved across the value stream.
This is shown in the timeline which is indicated below the process block area in a VSM as shown:
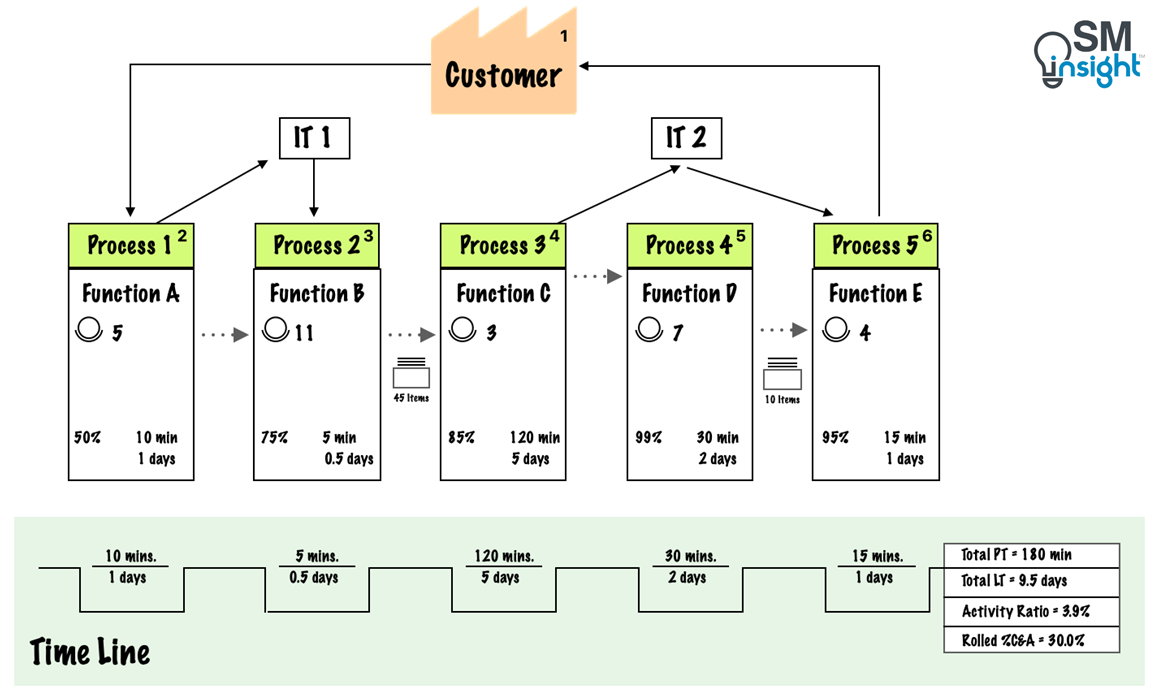
Calculating Summary Metrics: several summary metrics are used to describe the full value stream. The first 4 of the ones explained below are the most important:
- Total Lead Time (Total LT): This is the total time it takes to deliver on a customer request. When parallel processes exist, the longest lead time of the various parallel processes that form the timeline critical path of the value stream must be considered.
- Total Process Time (Total PT): The total work effort required by all functions on the timeline critical path of the value stream.
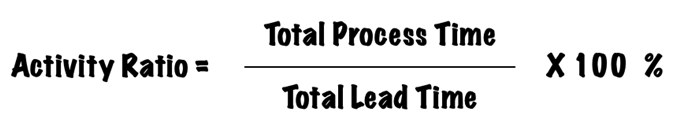
- Activity Ratio (AR): The degree of flow in a value stream measured by the ratio of the total process time to total lead time expressed in percentage.

It is common to see current state activity ratios in the 2 to 5 % range. While people are generally busy, the work is idle 95 to 98 % of the total time it takes work to flow through the value stream. - Rolled Percent Complete and Accurate (Rolled %C&A): Reflects the compounded effect of the quality of output across the value stream and is calculated by multiplying %C&A of each process as shown: (subscripts represent numbered process blocks)

Like Activity Ratio, Rolled %C&A can reveal a lot about processes. It typically ranges between 1 to 10% implying that 90 to 99 % of the work needs rework at some point across the value stream. - Total Labor Process Time: This is the sum of the process times of all of the process blocks on the map, including the timeline critical path blocks and all other parallel path process blocks, even if they’re part of a dead-end path.
- Total Labor Effort: Reflects the total human effort (annualized) that’s required to perform the work within the scope of the value stream being mapped. It is calculated by multiplying the total labor process time by the number of times the value stream processes customer requests each year.

Gaining a deep and collective understanding
Creating the current state value stream map is a discovery activity in which the mapping team’s role is to unearth the truth about the current state design, its performance, and the barriers that prevent flow or otherwise hinder performance.
The team may wish to use additional tools to help discover problems and opportunities for improvement, such as:
- Spaghetti diagrams[9] that depict the movement of people and material, the flow of information, or communication patterns
- Staff surveys to assess job satisfaction and engagement levels
- Pictures and videos of how work gets done
- Samples of work output etc.
The bottom line is that the team shouldn’t be limited to the value stream walk to gain the information it needs to gain a deep understanding of the current state.
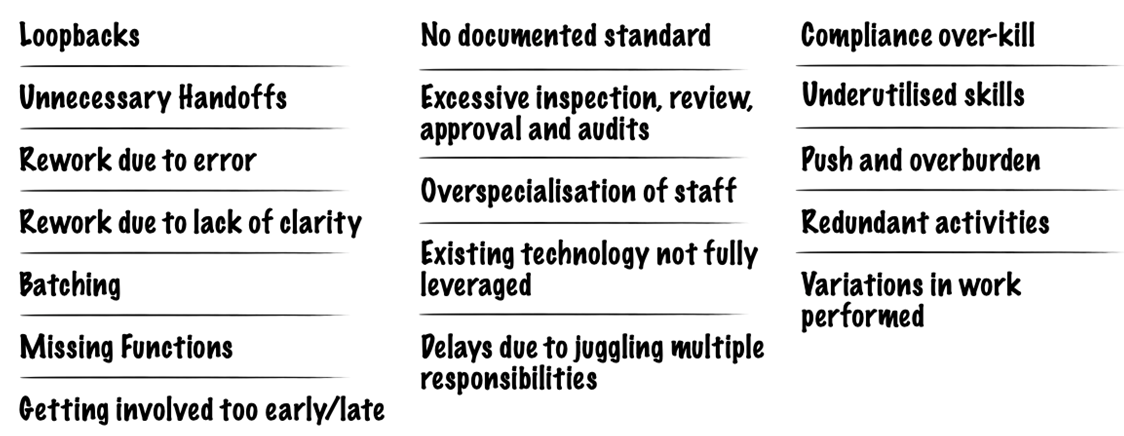
A current state map reflects how a customer request is transformed into a good or service and delivered to the customer. Common findings revealed through the current state mapping process include:
VSM Stage 3: Designing the Future State
In designing a Future State, the focus of the activity shifts from “fact-finding and discovery” to “innovation and creativity”. From a macro perspective, there are three overall considerations:
- Determining the ‘Right Work’
- Optimizing workflow
- Managing the workflow to achieve improved performance
Determining the “Right Work”
Optimal performance is delivering customer value in a way in which the organization incurs no unnecessary expense. Most value streams have plenty of waste which can be eliminated in two ways: eliminating work and adding work.
Eliminating work: removing processes and process steps
Removing work effort from a value stream (assuming removal doesn’t create a need for new work), leads to operational cost reduction. This process of elimination follows the priority as shown:
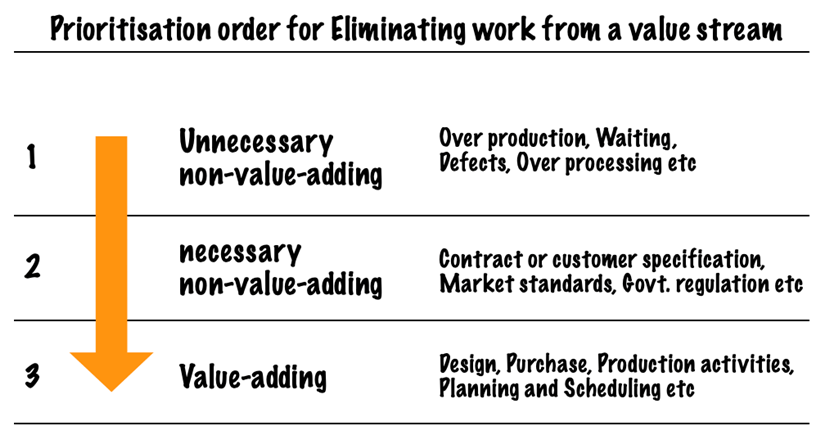
Removing work effort requires eliminating not just the work activities but also the need for that effort. For example, removing an inspection step that has existed to “ensure” quality requires the future state design to include quality-at-the-source improvements that eliminate the need for inspection.
Adding work – adding processes and process steps
Adding work requires change which is often met with resistance as it involves one department taking on additional work and/or people, redistributing authority, giving up some of its existing work and/or people, giving up equipment, or relocating staff.
This requires organizations to embrace value stream thinking – a move from siloed thinking (what’s best for me and my team?) to holistic thinking (what’s best for the customer and the company?).
If the overall PT and LT can be reduced and the customer experience improved, then the value stream design phase has been successful even if the time and effort required within a particular department increases.
Optimizing workflow
In an ideal workflow, a “work item” should move effortlessly from person to person, work team to work team, department to department, division to division without hang-ups, hiccups, headaches, or delays.
In optimizing a workflow, the team should ask a key question: What is preventing the lead time from being the same as the process time for each process block? In other words, what are the barriers to flow as they appear on the surface? What are the deeper root causes for them?
The team can then design a future state that results in lower LT, PT and higher %C&A for most process blocks.
Managing the Work
Managing the work involves asking two critical questions:
- How to determine if the value stream is performing as intended?
- Who will monitor and manage value stream performance?
Robust systems and measures need to be in place that address these two key requirements for continuously improving performance.
Every value stream needs two to five key performance indicators (KPIs) that are tracked on a regular basis. These KPIs are the critical few measures that reflect value stream performance and are tailored to the value stream and the specific target conditions desired.
During the mapping activity, the team should determine which KPIs will be used to monitor and manage the value stream, as well as who will be responsible for this activity.
Reviewing the charter, current state findings and countermeasures
The future state design phase begins by reviewing the charter once again to remind the team members of the target condition they aim to create. The team then reviews the current state findings.
This step highlights the key disconnects and waste observed as well as the summary metrics. The team also reviews the design ideas generated while documenting the current state, as well as the ideas submitted for consideration before and during the mapping activity.
Countermeasures for improving the value stream are then discussed. In most cases, standardizing the work, building in quality at the source, and installing visual management yield significant results.
The team can also use pull-systems[8], batch reduction[9], level loading[10], work balancing to take time[11], cells[12] and colocation, work segmentation, cross-training, automation, and other work design and management methods.
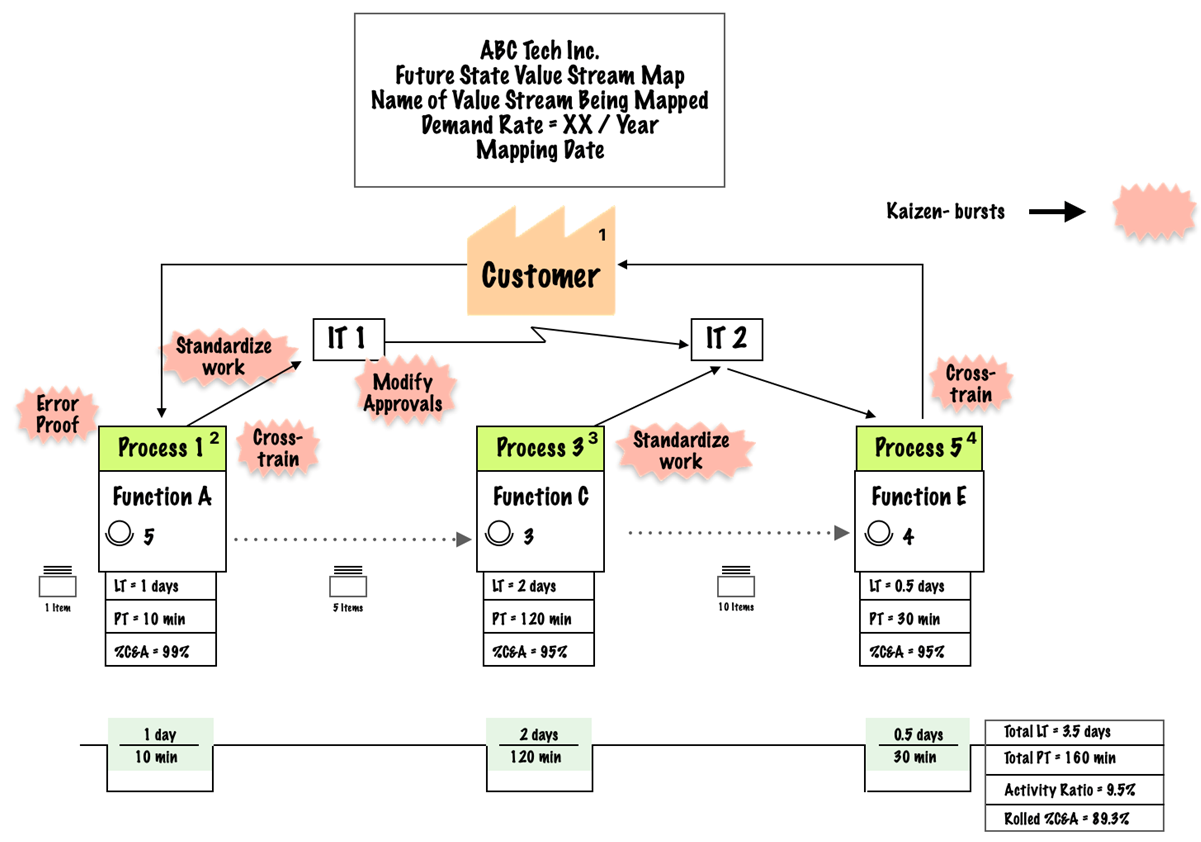
Creating the future state value stream map
Like CS-VSM, the Future State Value Stream Map (FS-VSM) begins on a fresh sheet of mapping paper with the goal to improve various value streams. Depending on the current state findings, it may be beneficial to work backwards from delivery to customer request.
The following set of questions can be used as a starting point for designing the future state:
| Area | Questions to be asked |
|---|---|
| General | – What are the business issues to be addressed? – What does the customer want? – What measurable target condition(s) are being aimed for? – Which process blocks add value or are necessary non-value-adding? – How delays between processes be reduced? – How the quality of incoming work at each process be improved? – How can work effort and other expenses across the value stream be reduced? – How can a more effective value stream be created? – How can the value stream performance be monitored? |
| Touch Points | – Are there redundant or unnecessary processes that can be eliminated? – Are there redundant or unnecessary handoffs that can be eliminated or combined? – Are there processes or handoffs that need to be added? |
| Delays | – Is work being processed frequently enough? – Can batch sizes be reduced or eliminated completely? – Is there adequate coverage and resources to accommodate existing and expected workloads? – How can more capacity be created ? – Is it possible to reduce the load at the bottleneck? |
| Sequencing and Pacing | – Is the work sequenced and synchronized properly? – Are processes being performed too early or too late in the value stream? – Are key stakeholders being engaged at the proper time? – Can processes be performed concurrently (in parallel)? – Would staggered starts improve flow? – How can the workload be balanced to achieve greater flow? |
| Variation Management | – Is there internally produced variation (e.g., end-of-quarter sales incentives)? – How can the incoming workload along the value stream be leveled to reduce variation? – Can variation in customer or internal requirements be reduced? – How can necessary variation be addressed most effectively? – Are there common prioritization rules in place throughout the value stream? |
| Technology | – Is redundant or unnecessary technology involved? – Is the available technology fully utilized? – Are the systems interconnected to optimize data movement? |
| Quality | – How can higher-quality input be received by each process in the value stream (to improve the %C&A metric)? – Is there an opportunity to standardize and error-proof work? |
| Labor Effort | – How can unnecessary non-value-adding work be eliminated? – How the labor effort in necessary non-value-adding work be eliminated? – How value-adding work be optimize? |
| Value Stream Management | – Do policies need changes to enable improved performance? – Are there organization departmental reporting structures that can be changed to reduce conflicting goals or align resources? – Do existing performance metrics (if any) encourage desired behaviors and discourage dysfunctional behavior? – What key performance indicators (KPIs) will we use to monitor value stream performance? – Who will monitor the KPIs? How frequently? Who else will results be communicated to? – What visual systems can be created to aid in managing and monitoring the value stream? |
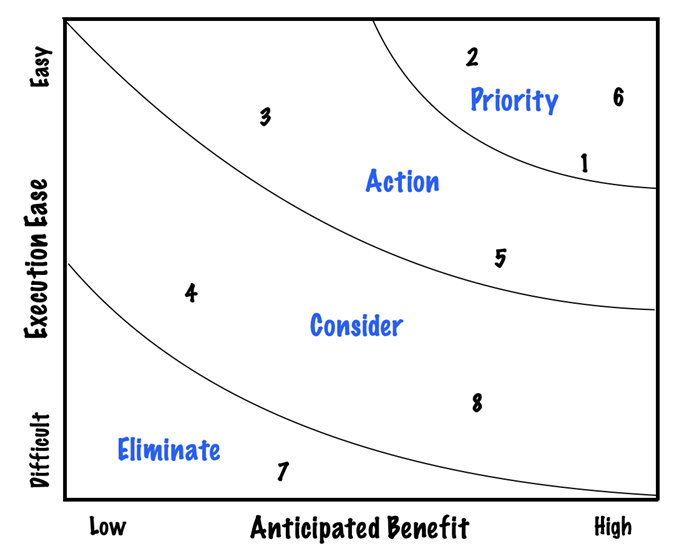
Brainstorming activity is a good way to generate the full range of countermeasures that could help achieve the future state target condition. These countermeasures are then numbered and placed in a basic prioritization grid as shown:
The FS-VSM can then be built using the same steps as the CS-VSM. The team must focus on a high-level description of what will be done and not on how the work will be done.
At this stage, the process blocks should only include the process description: no metrics, no department names, and no process block numbers. Next, the team should decide which functions will perform the work at each process, as well as the projected process time, lead time, and %C&A.
While it is important to be as realistic as possible, there are a significant number of unknowns at this stage which could alter predictions.
The team members should then create the timeline and calculate the projected summary metrics (same steps as in the current state map). The next step is to add the summary metrics to the results table as shown:
| Metrics | Current State | Future State (Projected) | Projected Improvement (%) |
|---|---|---|---|
| Total Lead Time | 9.5 days | 3.5 days | 63.2 % |
| Total Process Time | 180 minutes | 160 minutes | 11.1 % |
| Activity Ratio | 3.9 % | 9.5 % | 143.6 % |
| Rolled %C&A | 30.0 % | 89.3 % | 197.7 % |
| User Defined Metric-1 | |||
| User Defined Metric-2… |
Next, note the improvements that need to be made to realize the future state that the mapping team has designed. These improvements are visually depicted by using “kaizen bursts,” – an irregularly shaped icon that describes the improvements needed to realize the future state.
A kaizen burst should describe the improvement generally (what), not specifically (how). For example, the value stream mapping team could discover that work needs to be standardized. In this case, the kaizen burst should say ‘standardize work’.
VSM Stage 4: Developing the transformation plan
A value stream transformation plan is a living document that needs to be regularly updated and reviewed during leadership meetings to keep transformation activities tied to organizational strategy.
An example of a VSM Transformation plan is as shown:
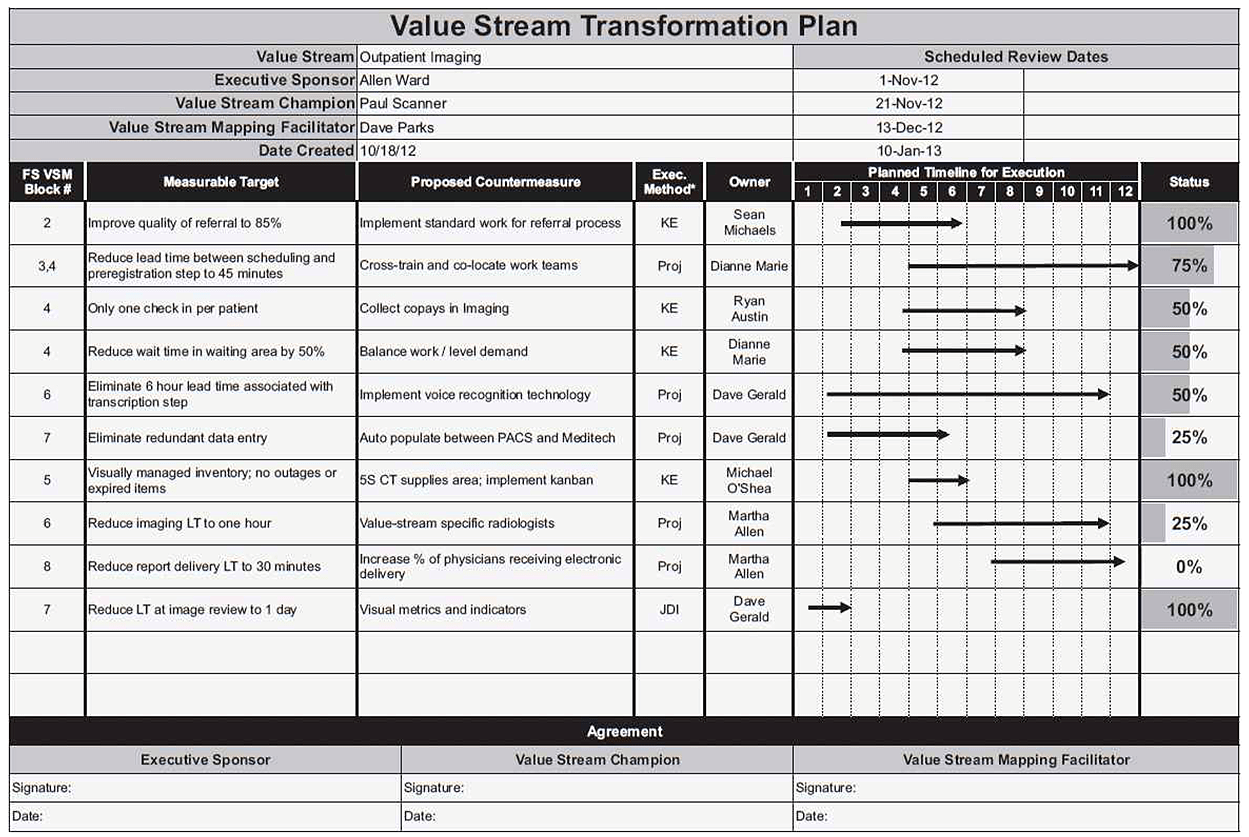
It consists of the following elements:
- Value Stream Name, Accountable Parties, and Date Created.
- Scheduled Review Dates.
- Future State Value Stream Map Block Numbers – the process block number(s) that an improvement is targeted to affect.
- Measurable Targets.
- Proposed Countermeasures.
- Method of execution – usually classified into three categories – (1) Just-do-its,
(2) Two- to five-day kaizen events (3) Complex projects. - Owner – one person ultimately accountable to ensure that each countermeasure is planned, designed, tested, adjusted implemented, and stabilized.
- The planned timeline for execution.
- Status
- Agreement
The overall transformation plan ownership must be with a sole accountable party, most commonly the value stream champion, who is often high enough in the organization to drive change but also is closer to the people responsible for execution at a tactical level.
The transformation plan owner typically runs the status meetings, helps troubleshoot if obstacles arise, supports those doing the work to realize the future state, and provides periodic updates to the executive sponsor, the senior leadership team, and whoever owns the strategy deployment plan.
VSM Stage 5: Executing the Transformation Plan
While clarity and ingenuity are required for creating current and future state maps, executing and sustaining the change requires focus and discipline.
It is critical that the value stream improvement is tied to business needs, organizational goals and priorities and the leaders who oversee the functions fully support the activity.
The mapping team must also include representation from all functions and must consist of people who have strategic authority. If not, then the future state map and transformation plan will have to go through a post-mapping sales cycle to gain the support of leaders in the areas that will be affected by the proposed changes.
To gain leadership support for the future state design and transformation plan, the team members must retell the story of the three days they spent together discovering, analyzing, and innovating.
Organizations can become distracted before they’ve executed a significant portion of the transformation plan. This is where leadership commitment and organizational focus play a crucial role.
Common VSM symbols and icons
Value stream mapping icons should be intuitive and unambiguous representations that enable quick and deep understanding. A few of the commonly used icons are as shown:
Organizations can also complement the standard set of icons with their own icons as long as they serve the purpose of enabling quick and deep understanding by all parties.
Sources
1. “Learning to See”. Mike Rother and John Shook, https://www.amazon.com/dp/0966784308?ref_=cm_sw_r_cp_ud_dp_X9WJCC1XGET6P2GSE8FH_1. Accessed 17 Aug 2023
2. ” The Machine That Changed the World”. James Womack, Dan Jones and Daniel Roos, https://www.lean.org/store/book/the-machine-that-changed-the-world/. Accessed 17 Aug 2023
3. “Value Stream Mapping: How to Visualize Work and Align Leadership for Organizational Transformation, 1st Edition”. Karen Martin and Mike Osterling, https://www.mheducation.com/highered/product/value-stream-mapping-how-visualize-work-align-leadership-organizational-transformation-martin-osterling/9780071828918.html. Accessed 17 Aug 2023
4. “Process Mapping”. Six Sigma Studyguide, https://sixsigmastudyguide.com/process-mapping/. Accessed 17 Aug 2023
5. “ABOUT DR. W. EDWARDS DEMING”. Deming.org, https://deming.org/learn/about-dr-deming/. Accessed 17 Aug 2023
6. “The PDSA Cycle (Plan-Do-Study-Act)”. Deming.org, https://deming.org/explore/pdsa/. Accessed 21 Aug 2023
7. “Strategy Deployment”. Lean Enterprise Institute, https://www.lean.org/lexicon-terms/strategy-deployment/. Accessed 18 Aug 2023
8. “Value Stream Mapping Templates to Immediately Discover Flows in Your Processes”. Creately, https://creately.com/guides/value-stream-mapping-templates/. Accessed 19 Aug 2023
9. “WHAT IS A SPAGHETTI DIAGRAM?”. American Society for Quality, https://asq.org/quality-resources/spaghetti-diagram. Accessed 21 Aug 2023
10. “What Is a Pull System? A Practical Guide to Increasing Process Efficiency”. Kanbanize, https://kanbanize.com/lean-management/pull/what-is-pull-system. Accessed 21 Aug 2023
11. “Principle 6 – Make Value Flow without Interruptions”. Scaled Agile Framework, https://scaledagileframework.com/make-value-flow-without-interruptions/. Accessed 21 Aug 2023
12. “Level Loading: A Lean Technique for Reducing Production Unevenness (Getting Started)”. Flowconsulting, https://flowconsulting.com/2017/03/30/lean-level-loading/. Accessed 21 Aug 2023
13. “Takt Time”. SixSigmaStudyGuide.com, https://sixsigmastudyguide.com/takt-time/. Accessed 21 Aug 2023
14. “Cellular Systems”. SixSigmaStudyGuide.com, https://sixsigmastudyguide.com/cellular-systems/. Accessed 21 Aug 2023
15. “Value Stream Mapping Symbols and Icons”. Lucidchart, https://www.lucidchart.com/pages/value-stream-mapping/value-stream-mapping-symbols. Accessed 21 Aug 2023